Unusually White and Wet Winter
The winter of 2007-2008 will go down as one of the wettest and snowiest winters on record at both Chicago and Rockford, as well as across much of the midwest. Here’s how the numbers break down at Rockford and Chicago...
Here are the snowiest seasons on record...

|
Years |
Snowfall Total |
|
1) 1978-1979 |
89.7" |
|
2) 1977-1978 |
82.3" |
|
3) 1969-1970 |
77.0" |
|
4) 1966-1967 |
68.4" |
|
5) 1951-1952 |
66.4" |
|
6) 1917-1918 |
64.1" |
|
7) 1964-1965 |
59.5" |
|
1903-1904 |
59.5" |
|
9) 1981-1982 |
59.3" |
|
10) 1961-1962 |
58.9" |
|
|
|
|
18) 2007-2008 |
52.4" |

|
Years |
Snowfall Total |
| 1) 1978-1979 | 74.5" |
|
2) 2007-2008 |
66.1" |
| 3) 1942-1943 | 61.0" |
| 4) 1974-1975 | 58.2" |
| 5) 1925-1926 | 56.7" |
| 6) 1911-1912 | 55.9" |
| 7) 1959-1960 | 55.2" |
| 8) 1958-1959 | 54.9" |
| 9) 1951-1952 | 54.7" |
| 10) 1935-1936 | 53.8" |
Here are the snowiest winters (Dec-Feb) on record...

|
Years |
Snowfall Total |
| 1) 1978-1979 | 80.6" |
| 2) 1977-1978 | 71.2" |
| 3) 1917-1918 | 59.9" |
| 4) 1966-1967 | 58.1" |
| 5) 1973-1974 | 54.2" |
| 6) 2007-2008 | 52.1" |
| 7) 1961-1962 | 50.0" |
| 8) 1884-1885 | 48.0" |
| 9) 1885-1886 | 47.3" |
| 10) 1907-1908 | 45.8" |

|
Years |
Snowfall Total |
| 1) 2007-2008 | 65.1" |
| 2) 1978-1979 | 63.4" |
| 3) 1993-1994 | 49.9" |
|
4) 1909-1910 |
48.9" |
| 5) 1973-1974 | 47.3" |
| 6) 1917-1918 | 46.4" |
| 7) 1935-1936 | 42.8" |
| 8) 1942-1943 | 41.0" |
| 9) 1987-1988 | 40.3" |
| 10) 1977-1978 | 40.2" |
Here are the snowiest Februarys on record...

|
Year |
Snowfall Total |
| 1) 1896 | 27.8" |
| 2) 1994 | 26.2" |
| 3) 1900 | 22.6" |
| 4) 1967 | 22.5" |
| 5) 2008 | 21.8" |
| 6) 1901 | 21.1" |
| 7) 2007 | 20.3" |
| 8) 1908 | 19.8" |
| 9) 1978 | 19.7" |
| 10) 1903 | 19.5" |

|
Year |
Snowfall Total |
| 1) 1994 | 30.2" |
| 2) 2008 | 25.8" |
| 3) 1944 | 21.8" |
| 4) 1975 | 21.4" |
| 5) 1960 | 19.5" |
| 6) 1936 | 18.0" |
| 7) 1912 | 15.8" |
| 8) 1946 | 15.5" |
| 9) 1974 | 15.1" |
| 1962 | 15.1" |
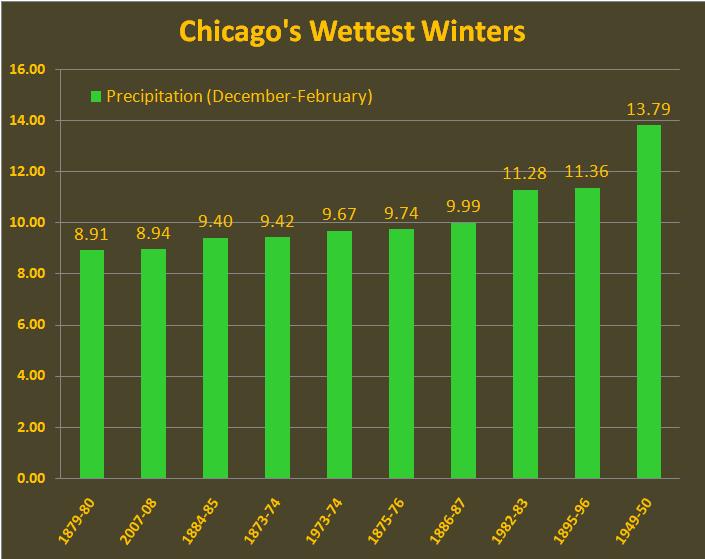
Here are the wettest winters on records...
|
Years |
Precipitation Total |
| 1) 1949-1950 | 13.79" |
| 2) 1895-1896 | 11.36" |
| 3) 1982-1983 | 11.28" |
| 4) 1886-1887 | 9.99" |
| 5) 1875-1876 | 9.74" |
| 6) 1973-1974 | 9.67" |
| 7) 1873-1874 | 9.42" |
| 8) 1884-1885 | 9.40" |
| 9) 2007-2008 | 8.94" |
| 10) 1979-1980 | 8.91" |
| 11) 1959-1960 | 8.89" |

|
Years |
Precipitation Total |
| 1) 1945-1946 | 10.38" |
| 2) 1959-1960 | 9.19" |
| 3) 1942-1943 | 8.76" |
| 4) 1936-1937 | 8.69" |
| 5) 1973-1974 | 8.52" |
| 6) 2007-2008 | 7.47" |
| 7) 2000-2001 | 7.26" |
| 8) 1987-1988 | 7.02" |
| 9) 1914-1915 | 6.82" |
| 10) 1992-1993 | 6.68" |
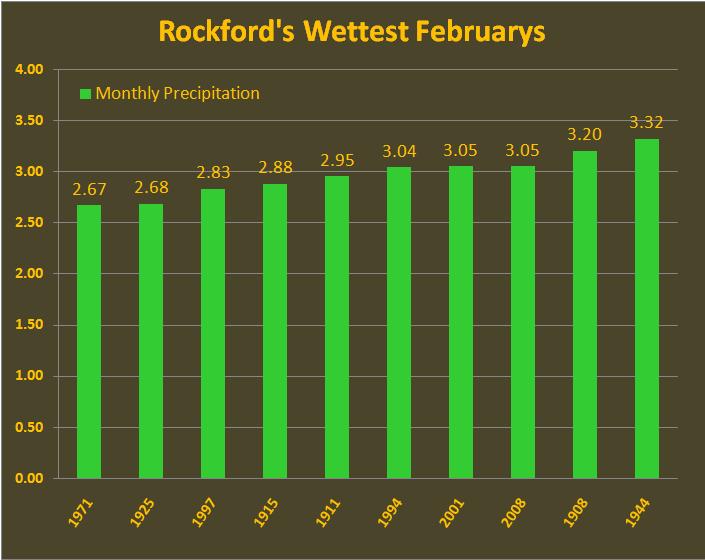
Here are the wettest Februarys on record...

|
Year |
Precipitation Total |
|
1) 1881 |
5.98" |
|
2) 1997 |
5.56" |
|
3) 1887 |
5.10" |
|
4) 1883 |
4.74" |
|
5) 1876 |
3.90" |
|
6) 1909 |
3.84" |
|
7) 1908 |
3.72" |
|
8) 2008 |
3.52" |
|
1896 |
3.52" |
|
10) 1896 |
3.48" |
|
|
|
|
Year |
Precipitation Total |
| 1) 1944 | 3.32" |
| 2) 1908 | 3.20" |
| 3) 2008 | 3.05" |
| 4) 2001 | 3.05" |
| 5) 1994 | 3.04" |
| 6) 1911 | 2.95" |
| 7) 1915 | 2.88" |
| 8) 1997 | 2.83" |
| 9) 1925 | 2.68" |
| 10) 1971 | 2.67" |
Here are some graphics showing approximate precipitation totals for the winter months across the midwest...
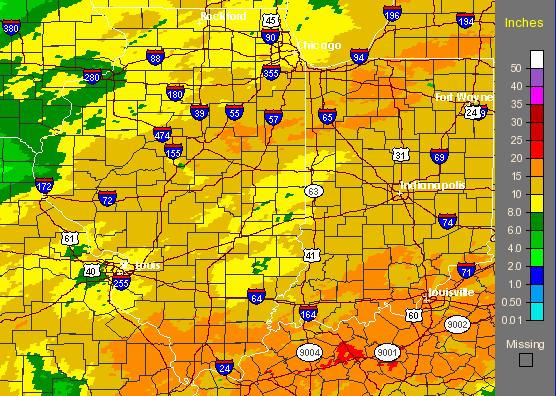
The map shows that all of northern Illinois picked up more than 8 inches of precipitation during the 90 day period ending in late February, with portions of east central Illinois into northwest Indiana picking up more than 15 inches of precipitation!
Here’s a map showing the departure from normal precipitation for the same period...

Notice that a swatch of the area from Bloomington through Iroquois county into northwest Indiana saw rainfall more than 8 inches above average during the past 3 months!
* = indicates that precipitation and snowfall totals are preliminary and only include precipitation that has fallen through February 26th.
Return to News Archive