|
|
 |
Urban Growth: Focusing on the Columbia River Region of Portland, Oregon
|
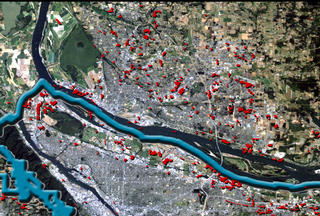
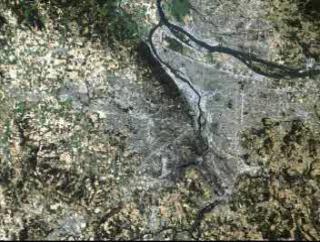
Using the Landsat satellite, scientists are able to study the urban sprawl of major cities. Red dots in these images indicate areas of growth between 1986 and 1996.
|
|

|
|
Starting with a view of the Portland, Oregon, vicinity, we push in to the north-eastern section, along the Columbia River. Red dots appear showing the areas where growth has occurred between 1986 and 1996.
Duration: 19.0 seconds
Available formats:
352x240 (29.97 fps)
MPEG-1
2 MB
160x80
PNG
30 KB
80x40
PNG
7 KB
320x242
JPEG
24 KB
How to play our movies
|
|
|
|
Red dots indicate areas of growth in the Portland, Oregon, and Vancouver, Washington, area.
Available formats:
2880 x 1944
TIFF
10 MB
160 x 80
PNG
32 KB
320 x 216
JPEG
33 KB
80 x 40
PNG
8 KB
|
|
|
Back to Top
|
|
|
|

