Hurricane Floyd: September 13, 1999
|
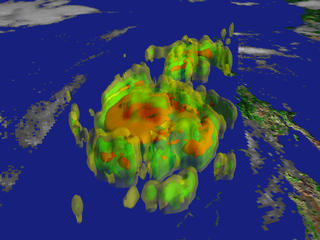
TRMM's view of Hurricane Floyd in 1999. Isosurfaces are: Yellow=0.5 inches/hour, Green=1.0 inches/hour, Red=2.0 inches/hour on rainfall rates. The vertical scale is exaggerated.
|
|

|
|
This movie transitions from a GOES view of Hurricane Floyd to precipitation data from TRMM.
Duration: 26.0 seconds
Available formats:
1280x720 (30 fps)
Frames
640x480 (30 fps)
MPEG-1
10 MB
1280x720 (30 fps)
MPEG-2
44 MB
320x240 (30 fps)
MPEG-1
3 MB
320x240
JPEG
12 KB
320x180
JPEG
10 KB
320x240
JPEG
12 KB
720x480 (29.97 fps)
DV
90 MB
320x240 (30 fps)
X-FLV
681 KB
How to play our movies
|
|

|
|
Approaching the TRMM swath. Cloud heights are determined from IR data.
Available formats:
2560 x 1920
TIFF
2 MB
320 x 240
JPEG
15 KB
|
|

|
|
The scan plane begins to peel-away the clouds, revealing the precipitation data.
Available formats:
2560 x 1920
TIFF
2 MB
320 x 240
JPEG
15 KB
|
|

|
|
The scan plane passes over the eye of the storm.
Available formats:
2560 x 1920
TIFF
2 MB
320 x 240
JPEG
18 KB
|
|

|
|
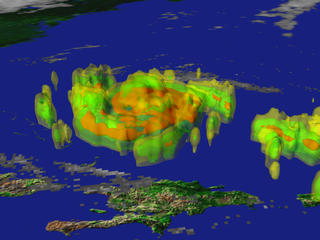
The main body of the storm is fully revealed to the precipitation radar.
Available formats:
2560 x 1920
TIFF
3 MB
320 x 240
JPEG
18 KB
|
|

|
|
Looking north across the hurricane.
Available formats:
2560 x 1920
TIFF
2 MB
320 x 240
JPEG
17 KB
|
|

|
|
Looking south across the hurricane.
Available formats:
2560 x 1920
TIFF
2 MB
320 x 240
JPEG
16 KB
|
|
|
|
Viewing the precipitation data along the TRMM swath.
Available formats:
2560 x 1920
TIFF
3 MB
160 x 80
PNG
18 KB
320 x 240
JPEG
18 KB
80 x 40
PNG
5 KB
|
|

|
|
Slate image from video tape reads, 'Hurricane Floyd: September 13, 1999; TRMM's view of Hurricane Floyd in 1999. Isosurfaces are: Yellow=0.5 inches/hour, green=1.0 inches/hour, red=2.0 inches/hour on rainfall rates. The vertical scale is exaggerated.'
Available formats:
720 x 528
JPEG
126 KB
320 x 234
PNG
361 KB
|
|
|
Back to Top
|

