|
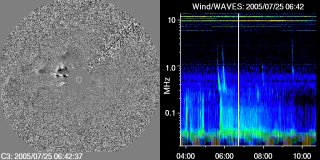
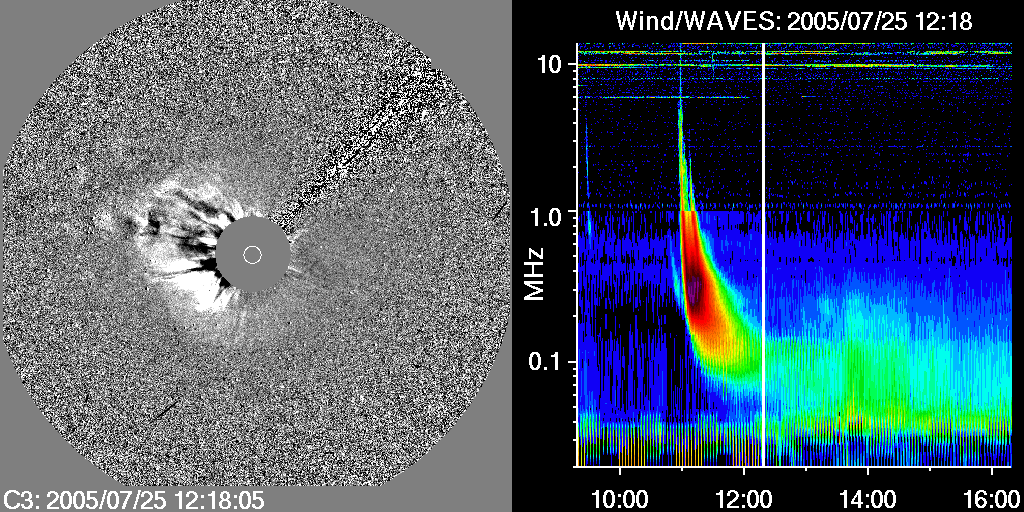
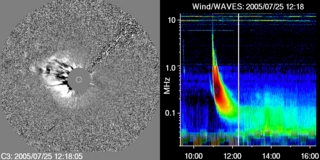
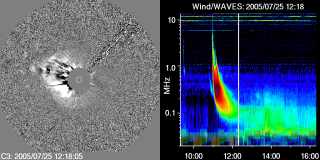
This is a simple comparison of SOHO/LASCO/C3 difference images (left side) combined with radio data from Wind/WAVES (right side). The LASCO difference images are produced from a time series of images by subtracting the previous image from the current image. Moving material therefore appears white on the leading edge and dark behind it. The WAVES spectrograph shows the variation of radio intensity (black is low, violet is high) in frequency (vertical axis) and time(horizontal axis). A vertical white bar marks the time of the LASCO image. This CME shows no radio-loud emission between 0.2-1.0 MHz.
|


