|
December 15, 2004
Greenland’s Ice Thinning More Rapidly at Edges
Ice in Greenland covers a huge area, far greater than the eye can see. Because ice is all white and can be as large as a continent, keeping
track of whether it is moving, thinning or thickening requires innovative approaches. Monitoring the white stuff is important because ice regulates
Earth’s climate by reflecting most of the Sun’s energy back out to space. Also, when ice melts or produces icebergs at its edges, it
raises sea levels.
One method for understanding ice behavior involves using a laser mounted on an airplane that can measure how high the surface of the ice is in
places and how the top might be changing. These laser altimeters, as they are called, send laser beams out of the bottom of an aircraft down to the
ice surface, where they bounce back up to a receiver on the airplane. Researchers use this instrument to measure the distance between the aircraft
and the surface. Global Positioning System receivers then determine the location of the aircraft. The combination of data yields a map of the heights
of the ice surfaces that is accurate to within 10 centimeters (3.9 inches).
Researchers recently used this method to assess ice changes in Greenland. The study, primarily funded by NASA, found that ice thinned along the
coastlines between 1997 and 2003 much more substantially than it had in the past. As the ice thinned, losing much of its volume to the surrounding
seas, Greenland’s contribution to sea level rise almost doubled between from the mid-1990s to the early 2000s. The mid-90s data showed this
contribution was about .13 millimeters (mm) (.005 inches) per year. In the period between 1997 and 2003, the melt-water addition from Greenland into
the oceans rose to .25 mm (.01 inches) per year.
The paper, will appear soon in the journal Geophysical Research Letters, also found while most of the coastal ice had thinned, ice thickened by
about a meter (3.2 feet) between 2002 and 2003 in Southeast Greenland. In the period between 1993 and 1997, this area had been thinning by 10 to 40
centimeters (3.9 to 15.7 inches) per year. The sudden thickening was due to some unusually large amounts of snowfall. While up to a meter of snowfall
a year would not be out of the ordinary for the area, around 3 meters (9.8 feet) of snow fell between May 2002 and May 2003. The study’s authors
wonder if this too might be a sign of climate change.
“This was the largest amount of snowfall we have observed in the area, by a long shot,” said the study’s lead author, Bill
Krabill, a physical scientist at NASA’s Wallops Space Flight Center, Wallops Island, Va. Ice cores from nearby this area show that in last 100
years there has never been this much snowfall in a single year.
Krabill said there is currently a debate between climate scientists over how global warming might affect ice in Greenland. Warm air has a higher
capacity for holding water, and computer models show that as the Earth and the Arctic warm, there will be more precipitation falling from a wetter
atmosphere. If more snow falls onto places like Greenland, it could offset the melting that takes place.
Some scientists say, however, that warming will eventually take over and further melt ice and snow found in these high latitudes.
This study reports that ice cover in the higher elevations of central Greenland has stayed mostly in balance over the last few decades. And since
the mid-90s elevations below 2000 meters have steadily thinned. But the unusually heavy snowfall complicates our understanding of how climate change
affects the ice sheet.
With all the recent news reports on the Arctic, this study stands out because it relies on direct observations of events. “Our data is a
very direct measurement of changes in the surface while other data implies changes or must be manipulated or analyzed to suggest that changes are
taking place,” Krabill said.
While the findings do point to rapid shifts in the Greenland climate, Krabill cautions that long-term data is needed to really tell what is
happening.
“The 10 to 12 years that we have been conducting these studies is very short in glaciological terms,” he adds. “These are
features that change over decades and centuries. You have to be cautious when talking about these short term changes, but we are seeing steady
trends.”
###
Contact:
Krishna Ramanujan
NASA GSFC
|
|
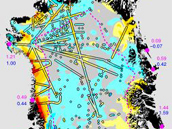
Greenland Ice Changes 1997 - 2003
The following image shows rates of elevation change in Greenland measured along aircraft flight lines during 1997-2003, superimposed on a map of
measurements from 1993-1999. Warm colors indicate elevation loss and cool colors represent elevation gain. Dark areas of red and blue indicate the
highest rates of change, -/+60 cm/year respectively. Credit: NASA

Laser Altimeters
A laser altimeter sends laser beams out of the bottom of an aircraft down to the ice surface, where they bounce back up to a receiver on the
airplane. Researchers use this instrument to measure the distance between the aircraft and the surface. Global Positioning System receivers then
determine the location of the aircraft. The combination of data yields a map of the heights of the ice surfaces that is accurate to within 10
centimeters (3.9 inches). Credit: NASA
|


