|
|
 |
Updated Jakobshavn Glacier Calving Front Retreat from 2001 through 2006
|
|
Since measurements of Jakobshavn Isbrae were first taken in 1850, the glacier has gradually receded, finally coming to rest at a certain point for the past 5 decades. However, from 1997 to 2006, the glacier has begun to recede again, this time almost doubling in speed. The finding is important for many reasons. As more ice moves from glaciers on land into the ocean, ocean sea levels raise. Jakobshavn Isbrae is Greenland's largest outlet glacier, draining 6.5 percent of Greenland's ice sheet area. The ice stream's speed-up and near-doubling of ice flow from land into the ocean has increased the rate of sea level rise by about .06 millimeters (about .002 inches) per year, or roughly 4 percent of the 20th century rate of sea level increase. This animation shows the glacier's flow in 2000, along with changes in the glacier's calving front between 2001 and 2006. This animation is an update of and extension to animation ID #3374. In this version, a pause is added on the approach to the Jakobshavn glacier in order to highlight the meltwater lakes visible on the Greenland ice sheet. In addition, semi-transparent overlays and text indicate different regions of the glacier before the calving lines are shown. After the calving front retreat, an additional segment shows a zoom to a global view. During the pull out, historic calving front locations are shown followed by a color overlay showing regions of increase and decrease in the Greenland ice sheet.
|
|

|
|
This animation shows the flow of the Jakobshavn glacier in 2000, followed by a time series of the glacier's retreat from 2001 through 2006. When pulling away from Greenland, a colored overlay shows the changes in the ice sheet elevation between 2003 and 2006.
Duration: 2.0 minutes
Available formats:
1280x720 (29.97 fps)
Frames
512x288 (30 fps)
MPEG-1
38 MB
1280x720 (30 fps)
MPEG-2
144 MB
1280x720 (30 fps)
MPEG-4
56 MB
320x180
PNG
273 KB
160x80
PNG
64 KB
80x40
PNG
16 KB
How to play our movies
|
|

|
|
This still image shows the glacier ice flow vectors in the year 2000.
Available formats:
2560 x 1440
TIFF
5 MB
320 x 180
PNG
299 KB
|
|

|
|
The calving front line from 07/07/2001 deliniates the area of floating icebergs from the solid glacial ice. Semi-transparent overlays identify the portion of the glacier which is over water (blue) and over land (tan).
Available formats:
2560 x 1440
TIFF
5 MB
320 x 180
PNG
292 KB
|
|
|
|
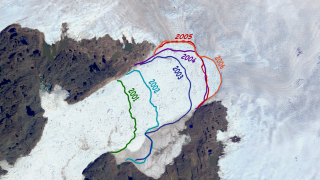
The calving front lines from 2001 through 2006 are shown over the Landsat image from 08/06/2006.
Available formats:
2560 x 1440
TIFF
6 MB
320 x 180
PNG
304 KB
|
|

|
|
The recession of calving front locations is shown over an image of the Jakobshavn glacier on 08/06/2006. Historic calving front locations from 1851 through 1964, compiled by Anker Weidick and Ole Bennike, are shown here in gray. Recent calving front locations, 2001 through 2006, derived from satellite imagery are show in colors.
Available formats:
2560 x 1440
TIFF
6 MB
320 x 180
PNG
306 KB
|
|

|
|
This image of Greenland shows the changes in elevation over the Greenland ice sheet between 2003 and 2006, The pink and red regions indicate a slight thickening, while the blue and purple shades indicate a thinning of the ice sheet.
Available formats:
2560 x 1440
TIFF
4 MB
320 x 180
PNG
276 KB
|
|

|
|
This is another view of changes in elevation over the Greenland ice sheet between 2003 and 2006,
Available formats:
2560 x 1440
TIFF
5 MB
320 x 180
PNG
287 KB
|
|

|
|
This colorbar represents the changes in elevation measured over Greenland. Warm colors indicate thickening and cool colors indicate thinning. Areas of no change are white.
Available formats:
320 x 90
PNG
8 KB
|
| Animation Number: | 3434 |
| Completed: | 2007-07-20 |
| Animator: | Cindy Starr (GST) (Lead) |
| Scientists: | Waleed Abdalati (NASA/GSFC) |
| | Richard Alley (Pennsylvania State University) |
| | Bob Bindschadler (NASA/GSFC) |
| | Jay Zwally (NASA/GSFC) |
| | Konrad Steffan (University of Colorado) |
| | Serdar Manizade (NASA/GSFC Wallops) |
| | Gordon Hamilton (University of Maine) |
| | Robert Thomas (NASA/GSFC-LARC) |
| | Ole Bennike (Geological Survey of Denmark and Greenland) |
| | Anker Weidick (Geological Survey of Denmark and Greenland) |
| Platforms/Sensors/Data Sets: | Aqua/AMSR-E
|
| | ICESat/GLAS |
| | Landsat-7/ETM+ |
| | Terra/MODIS |
| | Aqua/AMSR-E/Daily L3 6.25 km 89 GHz Brightness Temperature (Tb) |
| | Aqua/AMSR-E/Daily L3 12.5km Tb, Sea Ice Concentration, and Snow Depth |
| | ISTP/CGS/Model/Bow Shock |
| | Landsat-7/ETM+/Band Combination 3, 2, 1 |
| Data Collected: | MODIS imagery of Greenland (06/25/2003), Landsat Imagery (07/07/2001, 09/03/2002, 08/23/2003, 10/03/2004), ASTER Imagery(07/02/2005, 08/08/2006), MODIS Blue Marble Landcover, ICESat topography 2003 - 2006 |
Keywords:
DLESE
>> Cryology
SVS
>> HDTV
GCMD
>> EARTH SCIENCE
>> Cryosphere
GCMD
>> EARTH SCIENCE
>> Cryosphere
>> Sea Ice
GCMD
>> EARTH SCIENCE
>> Cryosphere
>> Snow/Ice
GCMD
>> EARTH SCIENCE
>> Hydrosphere
>> Snow/Ice
GCMD
>> EARTH SCIENCE
>> Cryosphere
>> Glaciers/Ice Sheets
>> Glacier Elevation/Ice Sheet Elevation
GCMD
>> EARTH SCIENCE
>> Cryosphere
>> Sea Ice
>> Ice Floes
GCMD
>> EARTH SCIENCE
>> Cryosphere
>> Sea Ice
>> Sea Ice Concentration
GCMD
>> EARTH SCIENCE
>> Cryosphere
>> Sea Ice
>> Sea Ice Motion
GCMD
>> EARTH SCIENCE
>> Cryosphere
>> Snow/Ice
>> Ice Growth/Melt
GCMD
>> EARTH SCIENCE
>> Cryosphere
>> Snow/Ice
>> Ice Motion
GCMD
>> EARTH SCIENCE
>> Hydrosphere
>> Snow/Ice
>> Ice Extent
GCMD
>> EARTH SCIENCE
>> Hydrosphere
>> Snow/Ice
>> Ice Motion
|
|
Please give credit for this item to
NASA/Goddard Space Flight Center Scientific Visualization Studio
The Blue Marble data is courtesy of Reto Stockli (NASA/GSFC). |
|
Back to Top
|
|
|
|

