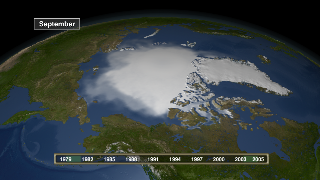
Three-Year Average September Minimum Sea Ice Concentration 1979 - 2005
|
Sea ice is frozen seawater floating on the surface of the ocean. Some sea ice is permanent, persisting from year to year, and some is seasonal, melting and refreezing from season to season. Because the extent of the sea ice is important both for the Arctic marine ecology and for the role it plays in the Earth's climate, understanding the variation of this extent during the year and from year-to-year is vital. Each year, the minimum sea ice extent in the northern hemisphere occurs at the end of summer, in September. By comparing the extent of the sea ice in September over many successive years, long term trends in the polar climate can be assessed. This animation shows the three-year moving average September mean sea ice concentration in the northern hemisphere from 1979-1981 through 2003-2005. Since 1999, this minimum has shown an ice extent that is consistently 10% to 15% smaller than the average extent over the past 20 years.
|
|

|
|
This animation shows the three-year moving average September mean sea ice concentration in the northern hemisphere from 1979-1981 through 2003-2005. A date bar indicates the range of years averaged to compute the September mean shown.
Duration: 12.0 seconds
Available formats:
1280x720 (29.97 fps)
Frames
(SeaIceWdates)
320x180
PNG
263 KB
160x80
PNG
67 KB
80x40
PNG
17 KB
512x288 (30 fps)
MPEG-1
1 MB
720x480 (29.97 fps)
MPEG-2
5 MB
256x144 (30 fps)
MPEG-1
822 KB
1280x720 (29.97 fps)
MPEG-2
23 MB
1280x720 (29.97 fps)
MPEG-4
8 MB
How to play our movies
|
|

|
|
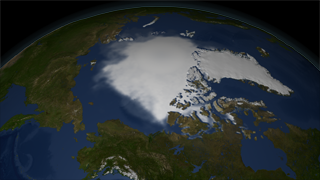
This element is the three-year moving average September mean sea ice concentration in the northern hemisphere from 1979-1981 through 2003-2005 without the date bar overlay.
Duration: 12.0 seconds
Available formats:
1280x720 (29.97 fps)
Frames
(SeaIce)
320x180
PNG
264 KB
1280x720 (29.97 fps)
MPEG-2
23 MB
1280x720 (29.97 fps)
MPEG-4
8 MB
512x288 (29.97 fps)
MPEG-1
1 MB
720x480 (29.97 fps)
MPEG-2
4 MB
How to play our movies
|
|

|
|
This element contains the overlay date bar that indicates the range of years averaged to compute the September mean along with a month label in the upper left corner.
Available formats:
1280x720 (29.97 fps)
Frames
(DateOverlay)
320x180
PNG
9 KB
How to play our movies
|
|
|
|
This animation dissolves between the 1979-1981 average September mean sea ice concentration and the 2003-2005 average September mean sea ice concentration.
Duration: 20.0 seconds
Available formats:
1280x720 (29.97 fps)
MPEG-2
40 MB
1280x720 (29.97 fps)
Frames
(Dissolve)
320x180
PNG
86 KB
512x288 (29.97 fps)
MPEG-1
2 MB
720x480 (29.97 fps)
MPEG-2
5 MB
1280x720 (29.97 fps)
MPEG-4
6 MB
How to play our movies
|
|
|
|
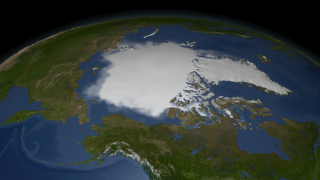
This still image shows the September mean sea ice concentration computed from the years 2003 through 2005.
Available formats:
2560 x 1440
TIFF
4 MB
320 x 180
PNG
93 KB
|
|
|
Back to Top
|

