AURA/OMI Tropospheric Ozone On a Flat Map
|
Aura's instruments study tropospheric, or low-level atmospheric chemistry and will monitor of air pollution around the world on a daily basis. Aura measures five of the six 'Criteria Pollutants' identified by the U.S. Environmental Protection Agency. The complexity of pollution transport makes it difficult to quantify how much industry contributes to poor local air quality.
|
|
|
|
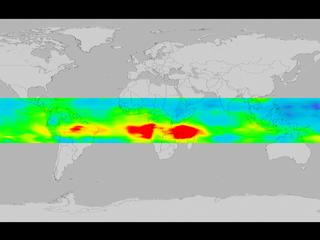
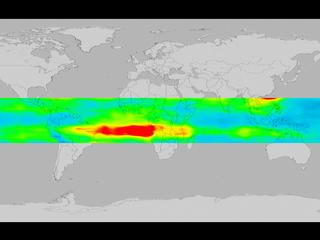
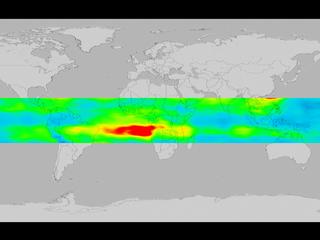
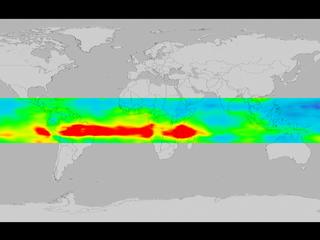
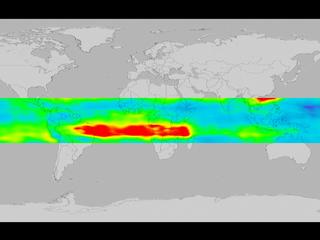
This animation shows ozone in the troposphere from September 28, 2004 to November 6, 2004. Areas of red represent high levels (50+ DU) and areas of blue represent low areas (20 DU).
Duration: 11.0 seconds
Available formats:
640x480 (29.97 fps)
MPEG-1
4 MB
720x480 (29.97 fps)
MPEG-2
7 MB
320x240 (29.97 fps)
MPEG-1
2 MB
320x240
JPEG
8 KB
320x240
JPEG
8 KB
How to play our movies
|
|
|
|
September 28, 2004 : Areas of red represent high levels (50+ DU) and areas of blue represent low areas (20 DU).
Available formats:
2560 x 1920
TIFF
3 MB
160 x 80
PNG
13 KB
320 x 240
JPEG
7 KB
80 x 40
PNG
4 KB
|
|

|
|
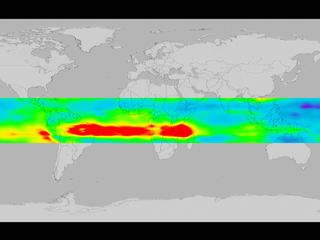
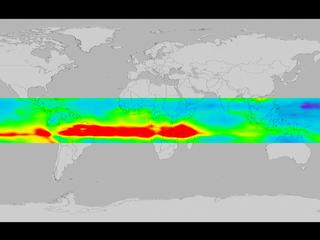
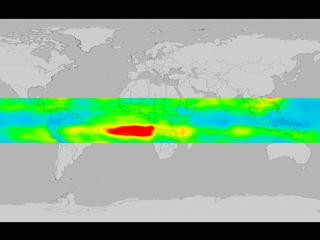
September 29, 2004
Available formats:
2560 x 1920
TIFF
3 MB
320 x 240
JPEG
7 KB
|
|

|
|
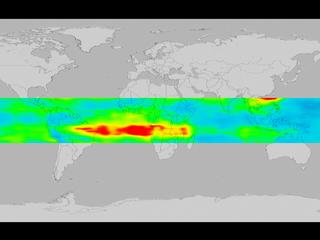
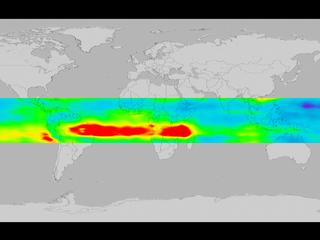
September 30, 2004
Available formats:
2560 x 1920
TIFF
3 MB
320 x 240
JPEG
7 KB
|
|
|
|
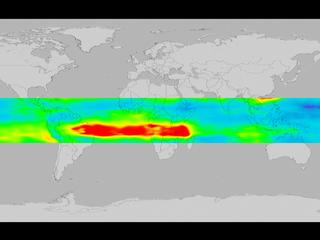
October 1, 2004
Available formats:
2560 x 1920
TIFF
3 MB
320 x 240
JPEG
7 KB
|
|

|
|
October 2, 2004
Available formats:
2560 x 1920
TIFF
3 MB
320 x 240
JPEG
7 KB
|
|

|
|
October 3,2004
Available formats:
2560 x 1920
TIFF
3 MB
320 x 240
JPEG
7 KB
|
|

|
|
October 4, 2004
Available formats:
2560 x 1920
TIFF
3 MB
320 x 240
JPEG
7 KB
|
|
|
|
October 5, 2004
Available formats:
2560 x 1920
TIFF
3 MB
320 x 240
JPEG
7 KB
|
|
|
|
October 6, 2004
Available formats:
2560 x 1920
TIFF
3 MB
320 x 240
JPEG
7 KB
|
|
|
|
October 7, 2004
Available formats:
2560 x 1920
TIFF
3 MB
320 x 240
JPEG
7 KB
|
|

|
|
October 8, 2004
Available formats:
2560 x 1920
TIFF
3 MB
320 x 240
JPEG
7 KB
|
|

|
|
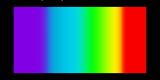
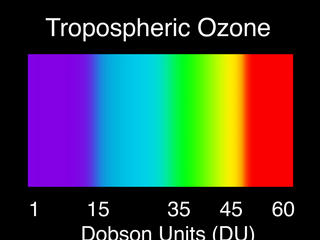
Tropospheric Ozone Colorbar
Available formats:
2560 x 1920
TIFF
1 MB
160 x 80
PNG
1 KB
320 x 240
JPEG
10 KB
|
|
|
Back to Top
|

