FOR FURTHER INFORMATION:                                                                      FOR RELEASE:
Cheryl Abbot, Regional Economist                                                              July 30, 2009
(972) 850-4800
http://www.bls.gov/ro6/


                            COUNTY EMPLOYMENT AND WAGES IN ARKANSAS: FOURTH QUARTER 2008

     Employment declined in the three largest counties in Arkansas from December 2007 to December 2008.  (Large
counties are defined as those with employment of 75,000 or more as measured by 2007 annual average employment.)
Washington County had the largest decrease, down 2.4 percent, closely followed by Benton where employment fell
2.2 percent.  Regional Commissioner Stanley W. Suchman noted that Pulaski County experienced a slower rate of
job loss, declining 1.2 percent over the year.

     In comparison, employment nationwide fell 2.3 percent during the 12-month period as 285 of the 334 largest
U.S. counties registered declines.  Elkhart County, Ind., recorded the largest over-the-year percentage decrease
in employment in the country, down 17.8 percent, while Montgomery County, Texas, experienced the fastest growth,
up 2.7 percent.

     Among the three largest counties in Arkansas, employment was highest in Pulaski County (250,300) in December
2008.  The two other large Arkansas counties, Benton and Washington, had employment levels below 100,000.
Employment in the three large counties accounted for 37.3 percent of the State’s total employment.  Nationwide,
the 334 largest counties made up 71.5 percent of total U.S. employment.

     From the fourth quarter of 2007 to the fourth quarter of 2008, Benton County recorded the fastest rate of
increase in average weekly wages among Arkansas' largest counties, registering a gain of 6.3 percent.  (See
table 1.)  Pulaski County had the highest wage level among the three large counties at $847 per week.
Nationally, the average weekly wage increased 2.2 percent over the year to $918 in the fourth quarter of 2008.

     Employment and wage levels (but not over-the-year changes) are also available for the 72 counties in
Arkansas with employment levels below 75,000.  All of the smaller counties had wage levels below the national
average, but two -- Little River and Calhoun -- had average weekly wages above the State’s largest counties.
(See table 2.)


Large County Wage Changes
     Benton County's 6.3-percent wage gain from the fourth quarter of 2007 to the fourth quarter of 2008 far
surpassed the national average of 2.2 percent and ranked 15th among the nation’s largest counties.  (See
table 1.)  Washington County registered a 2.2-percent wage increase during the period, matching the national
average and ranking 181st.  In contrast, Pulaski County’s 14.3-percent decline was the largest in both the
State and the nation.  A year-ago, Pulaski County ranked first in the country in wage growth.

     Nationwide, 180 large counties experienced higher over-the-year wage gains than the U.S. average.  St.
Louis City, Mo., ranked first in wage growth, with an increase of 56.8 percent coming predominantly from the
professional and business services and manufacturing supersectors.  Clayton County, Ga., was second with wage
growth of 9.9 percent.  These two top-ranked areas were followed by Calcasieu and East Baton Rouge, La., and
Jefferson, Texas, areas still recovering from previous hurricane-related losses.

     Wage growth was below the national average in 137 large counties in the United States and 43 of these
experienced over-the-year declines.  As mentioned, Pulaski had the largest decrease in the nation and was the
only county to experience a double-digit decrease (-14.3 percent).  Pulaski was followed by the counties of
Lake, Ill. (-9.9 percent), Santa Clara, Calif. (-7.8 percent), Douglas, Colo. (-5.9 percent), and San Mateo,
Calif. (-5.4 percent).


Large County Average Weekly Wages
     Despite Pulaski County's sharp over-the-year decline, its average weekly wage of $847 was the highest
among the three large Arkansas counties.  Benton County closely followed at $844, after its above-average wage
gain.  Both counties were within 10 percent of the national average ($918) and ranked in the middle of the 334
large U.S. counties.  Washington County’s average weekly wages were notably lower ($747) and ranked 277th.

     There were 106 counties with an average weekly wage above the national average in the fourth quarter of
2008.  New York, N.Y., held the top position among the highest-paid large counties with an average weekly wage
of $1,856.  Fairfield, Conn., was second with an average weekly wage of $1,596, followed by Washington, D.C.
($1,570), Suffolk, Mass. ($1,568), and Santa Clara, Calif. ($1,566).

     More than two-thirds of the largest U.S. counties (228) reported average weekly wages below the national
average.  The lowest was reported in Hidalgo, Texas ($574), followed by the counties of Horry, S.C. ($581),
Cameron, Texas ($584), and Webb, Texas ($600).  Wages in these lowest-ranked counties were less than one-third
of the average weekly wage reported for the highest-ranked county, New York.


Average Weekly Wages in Smaller Arkansas Counties
     All 72 smaller counties in Arkansas, those with employment below 75,000, had average weekly wages lower
the national average of $918.  However, two of these, Little River ($880) and Calhoun ($855), reported wage
levels above the three largest Arkansas counties.  Newton County reported the lowest weekly wage among the
smaller counties, as well as the State, averaging $425 in the fourth quarter of 2008.  (See table 2.)

     When all 75 counties in Arkansas were considered, 13 reported average weekly wages under $500, 37 reported
wages from $500 to $599, 17 had wages from $600 to $699, 4 had wages from $700 to $799, and 4 were above $800
per week.  (See chart 1.)  The four top-paying counties included, or were near the areas of, Camden,
Fayetteville, Little Rock, and Texarkana.  The lower-paid counties, those with wages under $500, were generally
located along the western and northern borders of the State.


Additional Statistics and Other Information
     QCEW data for states has been included in this release in table 3. For additional information about
quarterly employment and wages data, please read the Technical Note or visit the QCEW Web site at
www.bls.gov/cew/.

     An annual bulletin, Employment and Wages, features comprehensive information by detailed industry on
establishments, employment, and wages for the nation and all states.  The 2007 edition of this bulletin
contains selected data produced by Business Employment Dynamics (BED) on job gains and losses, as well as
selected data from the first quarter 2008 version of the news release.  Tables and additional content from the
2007 Employment and Wages Annual Bulletin are now available online at www.bls.gov/cew/cewbultn07.htm.  These
tables present final 2007 annual averages.  The tables are also included on the CD which accompanies the
hardcopy version of the Annual Bulletin.  Employment and Wages Annual Averages, 2007 is available online as a
chartbook or for sale from the United States Government Printing Office, Superintendent of Documents, P.O. Box
371954, Pittsburgh, PA 15250, telephone (866) 512-1800, outside Washington, D.C.  Within Washington, D.C., the
telephone number is (202) 512-1800.  The fax number is (202) 512-2104.

     Information in this release will be made available to sensory impaired individuals upon request.  Voice
phone: 202-691-5200; TDD message referral phone number: 1-800-877-8339.

     For personal assistance or further information on the Quarterly Census of Employment and Wages Program, as
well as other Bureau programs, contact the Dallas Information Office at 972-850-4800 from 8:00 a.m. to 11:00
a.m. and 1:00 p.m. to 4:00 p.m. CT.


                                               Technical Note

     Average weekly wage data by county are compiled under the Quarterly Census of Employment and Wages (QCEW)
program, also known as the ES-202 program.  The data are derived from summaries of employment and total pay of
workers covered by state and federal unemployment insurance (UI) legislation and provided by State Workforce
Agencies (SWAs).  The 9.1 million employer reports cover 136.6 million full- and part-time workers.  The
average weekly wage values are calculated by dividing quarterly total wages by the average of the three monthly
employment levels of those covered by UI programs.  The result is then divided by 13, the number of weeks in a
quarter.  It is to be noted, therefore, that over-the-year wage changes for geographic areas may reflect shifts
in the composition of employment by industry, occupation, and such other factors as hours of work.  Thus, wages
may vary among counties, metropolitan areas, or states for reasons other than changes in the average wage
level.  Data for all states, Metropolitan Statistical Areas (MSAs), counties, and the nation are available on
the BLS Web site at www.bls.gov/cew/; however, data in QCEW press releases have been revised and may not match
the data contained on the Bureau’s Web site.

     QCEW data are not designed as a time series.  QCEW data are simply the sums of individual establishment
records reflecting the number of establishments that exist in a county or industry at a point in time.
Establishments can move in or out of a county or industry for a number of reasons—some reflecting economic
events, others reflecting administrative changes.

     The preliminary QCEW data presented in this release may differ from data released by the individual states
as well as from the data presented on the BLS Web site.  These potential differences result from the states’
continuing receipt, review and editing of UI data over time.  On the other hand, differences between data in
this release and the data found on the BLS Web site are the result of adjustments made to improve over-the-year
comparisons.  Specifically, these adjustments account for administrative (noneconomic) changes such as a
correction to a previously reported location or industry classification.  Adjusting for these administrative
changes allows users to more accurately assess changes of an economic nature (such as a firm moving from one
county to another or changing its primary economic activity) over a 12-month period.  Currently, adjusted data
are available only from BLS press releases.
| Area | Employment | Average Weekly Wage (3) | |||||
|---|---|---|---|---|---|---|---|
| December 2008 (thousands) |
Percent change, December 2007-08 (4) |
National ranking by percent change (5) |
Average weekly wage |
National ranking by level (5) |
Percent change, fourth quarter 2007-08 (4) |
National ranking by percent change (5) |
|
United States (6) |
133,870.4 | -2.3 | -- | $918 | -- | 2.2 | -- |
Arkansas |
1,168.2 | -1.5 | 18 | 706 | 47 | -1.0 | 50 |
Benton, Ark. |
94.7 | -2.2 | 160 | 844 | 168 | 6.3 | 15 |
Pulaski, Ark. |
250.3 | -1.2 | 92 | 847 | 164 | -14.3 | 324 |
Washington, Ark. |
90.9 | -2.4 | 177 | 747 | 277 | 2.2 | 181 |
|
Footnotes: |
|||||||
| Area | Employment December 2008 |
Average Weekly Wage (3) |
|---|---|---|
United States (4) |
133,870,395 | $918 |
Arkansas |
1,168,162 | 706 |
Arkansas |
10,040 | 662 |
Ashley |
7,853 | 697 |
Baxter |
14,551 | 596 |
Benton |
94,662 | 844 |
Boone |
13,839 | 617 |
Bradley |
3,529 | 528 |
Calhoun |
2,966 | 855 |
Carroll |
9,959 | 501 |
Chicot |
3,458 | 503 |
Clark |
9,860 | 539 |
Clay |
3,977 | 514 |
Cleburne |
6,859 | 554 |
Cleveland |
1,096 | 428 |
Columbia |
9,100 | 686 |
Conway |
7,081 | 610 |
Craighead |
42,952 | 658 |
Crawford |
19,766 | 586 |
Crittenden |
16,711 | 627 |
Cross |
5,134 | 551 |
Dallas |
3,424 | 539 |
Desha |
4,545 | 586 |
Drew |
6,767 | 517 |
Faulkner |
39,326 | 690 |
Franklin |
4,379 | 616 |
Fulton |
2,013 | 455 |
Garland |
36,543 | 592 |
Grant |
3,854 | 551 |
Greene |
15,314 | 550 |
Hempstead |
7,984 | 576 |
Hot Spring |
7,543 | 607 |
Howard |
7,611 | 539 |
Independence |
15,342 | 618 |
Izard |
3,135 | 482 |
Jackson |
5,571 | 588 |
Jefferson |
32,730 | 715 |
Johnson |
9,094 | 548 |
Lafayette |
1,431 | 548 |
Lawrence |
4,059 | 496 |
Lee |
2,143 | 521 |
Lincoln |
2,992 | 543 |
Little River |
4,865 | 880 |
Logan |
5,800 | 543 |
Lonoke |
12,630 | 573 |
Madison |
3,200 | 517 |
Marion |
3,813 | 497 |
Miller |
12,981 | 641 |
Mississippi |
19,461 | 723 |
Monroe |
2,272 | 507 |
Montgomery |
1,569 | 488 |
Nevada |
2,421 | 541 |
Newton |
1,103 | 425 |
Ouachita |
7,711 | 569 |
Perry |
1,431 | 601 |
Phillips |
6,642 | 520 |
Pike |
2,803 | 512 |
Poinsett |
5,470 | 573 |
Polk |
6,479 | 480 |
Pope |
26,703 | 652 |
Prairie |
1,433 | 568 |
Pulaski |
250,252 | 847 |
Randolph |
4,923 | 474 |
St. Francis |
8,279 | 595 |
Saline |
21,269 | 612 |
Scott |
3,020 | 510 |
Searcy |
1,764 | 438 |
Sebastian |
71,940 | 689 |
Sevier |
5,579 | 491 |
Sharp |
3,802 | 467 |
Stone |
2,931 | 453 |
Union |
18,805 | 756 |
Van Buren |
3,786 | 516 |
Washington |
90,905 | 747 |
White |
25,325 | 691 |
Woodruff |
1,990 | 539 |
Yell |
7,066 | 531 |
|
Footnotes |
||
| State | Employment | Average weekly wage (3) | ||||
|---|---|---|---|---|---|---|
| December 2008 (thousands) |
Percent change, December 2007-08 |
Average weekly wage |
National ranking by level |
Percent change, fourth quarter 2007-08 |
National ranking by percent change |
|
United States (4) |
133,870.4 | -2.3 | $918 | - | 2.2 | - |
Alabama |
1,909.8 | -3.1 | 790 | 33 | 3.5 | 16 |
Alaska |
303.9 | 1.6 | 927 | 14 | 5.7 | 4 |
Arizona |
2,557.9 | -5.1 | 848 | 23 | 2.7 | 25 |
Arkansas |
1,168.2 | -1.5 | 706 | 47 | -1.0 | 50 |
California |
15,288.5 | -3.2 | 1,042 | 6 | 0.7 | 48 |
Colorado |
2,295.8 | -1.5 | 932 | 13 | 0.5 | 49 |
Connecticut |
1,688.0 | -1.7 | 1,164 | 3 | 1.2 | 44 |
Delaware |
416.8 | -3.0 | 943 | 10 | 1.9 | 36 |
District of Columbia |
687.5 | 0.3 | 1,570 | 1 | 5.1 | 6 |
Florida |
7,586.6 | -5.3 | 824 | 26 | 1.6 | 39 |
Georgia |
3,970.3 | -3.5 | 853 | 21 | 2.3 | 33 |
Hawaii |
614.7 | -3.5 | 821 | 28 | 3.5 | 16 |
Idaho |
634.1 | -3.9 | 693 | 48 | 1.0 | 45 |
Illinois |
5,795.8 | -2.3 | 985 | 8 | 1.0 | 45 |
Indiana |
2,831.3 | -3.4 | 764 | 38 | 2.7 | 25 |
Iowa |
1,483.7 | -1.0 | 756 | 39 | 3.1 | 19 |
Kansas |
1,370.2 | -0.2 | 769 | 36 | 3.1 | 19 |
Kentucky |
1,783.2 | -2.6 | 754 | 41 | 3.0 | 21 |
Louisiana |
1,907.5 | 0.1 | 829 | 25 | 5.9 | 3 |
Maine |
595.3 | -2.1 | 735 | 42 | 4.0 | 11 |
Maryland |
2,531.8 | -1.9 | 1,010 | 7 | 2.4 | 31 |
Massachusetts |
3,239.6 | -1.1 | 1,154 | 4 | 1.8 | 38 |
Michigan |
3,993.3 | -4.9 | 903 | 17 | 3.6 | 15 |
Minnesota |
2,658.8 | -1.9 | 907 | 16 | 2.6 | 27 |
Mississippi |
1,117.2 | -2.8 | 679 | 49 | 3.8 | 13 |
Missouri |
2,700.9 | -1.7 | 842 | 24 | 7.9 | 1 |
Montana |
433.8 | -1.5 | 678 | 50 | 2.9 | 23 |
Nebraska |
923.1 | -0.3 | 730 | 45 | 1.0 | 45 |
Nevada |
1,206.5 | -6.5 | 862 | 20 | -1.1 | 51 |
New Hampshire |
626.2 | -2.0 | 936 | 11 | 2.2 | 34 |
New Jersey |
3,927.7 | -2.4 | 1,123 | 5 | 2.8 | 24 |
New Mexico |
821.2 | -1.2 | 768 | 37 | 3.9 | 12 |
New York |
8,677.4 | -1.0 | 1,169 | 2 | 1.4 | 40 |
North Carolina |
4,003.8 | -3.0 | 793 | 31 | 1.9 | 36 |
North Dakota |
354.4 | 1.9 | 725 | 46 | 5.1 | 6 |
Ohio |
5,167.5 | -3.2 | 816 | 29 | 2.6 | 27 |
Oklahoma |
1,559.8 | 0.0 | 755 | 40 | 4.9 | 8 |
Oregon |
1,676.6 | -3.7 | 808 | 30 | 1.3 | 43 |
Pennsylvania |
5,645.8 | -1.3 | 897 | 18 | 2.6 | 27 |
Rhode Island |
464.3 | -3.4 | 887 | 19 | 5.7 | 4 |
South Carolina |
1,837.1 | -3.5 | 731 | 44 | 2.1 | 35 |
South Dakota |
395.2 | 0.4 | 663 | 51 | 2.5 | 30 |
Tennessee |
2,695.7 | -3.3 | 824 | 26 | 1.4 | 40 |
Texas |
10,510.8 | 0.4 | 933 | 12 | 2.4 | 31 |
Utah |
1,215.0 | -2.1 | 770 | 35 | 1.4 | 40 |
Vermont |
304.4 | -1.7 | 774 | 34 | 4.3 | 9 |
Virginia |
3,656.8 | -1.3 | 953 | 9 | 3.3 | 18 |
Washington |
2,885.0 | -1.8 | 918 | 15 | 3.7 | 14 |
West Virginia |
713.8 | -0.1 | 735 | 42 | 7.1 | 2 |
Wisconsin |
2,753.2 | -1.9 | 793 | 31 | 3.0 | 21 |
Wyoming |
284.5 | 1.5 | 850 | 22 | 4.3 | 9 |
Puerto Rico |
1,028.5 | -2.9 | 528 | (5) | 2.3 | (5) |
Virgin Islands |
45.5 | -1.4 | 731 | (5) | -0.8 | (5) |
|
Footnotes: |
||||||
Chart 1. Average weekly wages by county in Arkansas, fourth quarter 2008
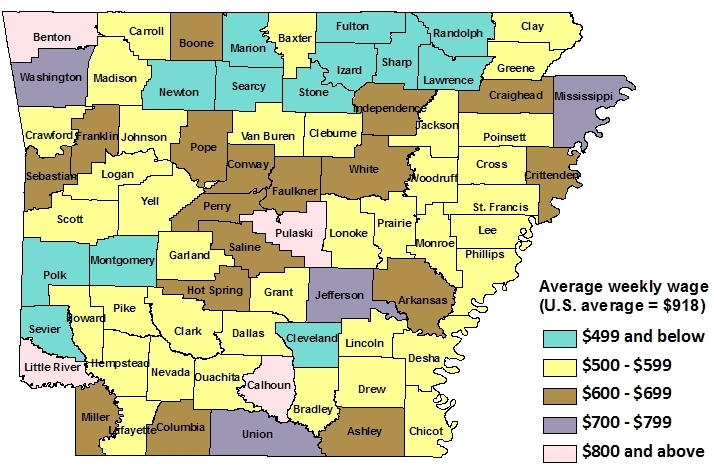
Source: U.S. Bureau of Labor Statistics
Last Modified Date: July 31, 2009