Access to Wellness and Employee Assistance Programs in the United States
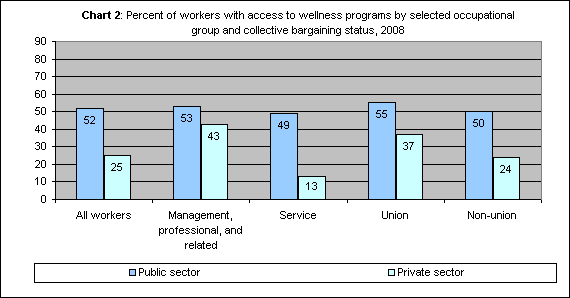
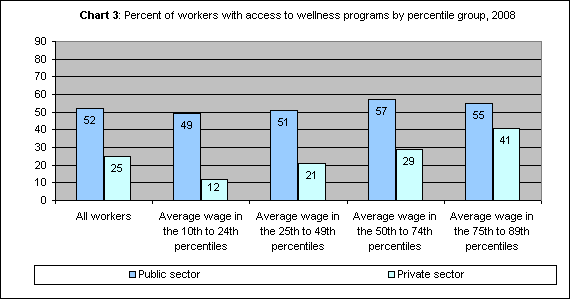
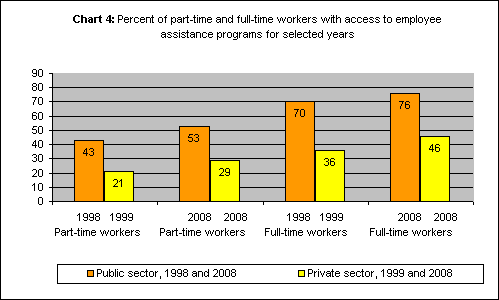
Originally Posted: April 22, 2009 Wellness programs and employee assistance programs are important benefits for workers and their employers; data from the National Compensation Survey (NCS) show that workers in the public and private sectors had greater access to these kinds of benefits in 2008 than they did a decade earlier. Moreover, for all worker groups examined in this study, public sector workers have higher rates of access to wellness programs and employee assistance programs than do private sector workers. In an age of ever-increasing health care costs and health risk awareness, services that promote health and wellness have become an important element of U.S. society. A discussion paper recently published by the Brookings Institution points out that there is an “emerging, multibillion dollar wellness industry”1 in the United States that provides services such as nutrition education, physical fitness, and stress management--proactive measures aimed at reducing medical care costs and improving the quality of life. Many workers in the United States have access to these services through their employer’s benefits packages, some of which include wellness programs and employee assistance programs. Wellness programs are considered to be an important component of employer benefits packages because they offer workers and their families choices for pursuing healthier lifestyles with less illness, ultimately leading to less costly benefits packages.2 Wellness programs often include a health education and awareness component and, according to some analysts, these programs address issues that increase worker satisfaction and productivity. Employee assistance programs typically deal with more serious personal problems than the essentially medical issues included in wellness programs. Employee assistance programs provide employees with access to referral or counseling services for problems such as alcohol or drug abuse, as well as for financial and legal difficulties. (See the glossary for more information on these benefits.) The National Compensation Survey (NCS) collects and publishes benefits data on the civilian economy, with separate estimates for State and local government (referred to here as the public sector) and for private industry.3 Benefits data include information on the prevalence of wellness programs and employee assistance programs in the workplace for a variety of employer and employee characteristics. NCS data show that public sector workers have greater access to wellness programs and employee assistance programs than do private sector workers. The difference in access can be attributed to a number of factors, including occupational composition and the different job functions of public and private sector workers.4 For example, the ratio of public sector workers in education and public safety jobs is relatively high compared with private sector workers. According to NCS data, about 55 percent of public sector workers are employed in management, professional, and related jobs, which includes teachers and university professors; and about 45 percent of public sector service workers are employed in protective service jobs such as police officers and firefighters. (See exhibit 1.) These jobs require a high degree of specialized education and training, as well as physical fitness, and in some cases, a considerable amount of personal risk; and generally these jobs are associated with relatively higher pay and greater access to benefits. A larger percentage of public sector workers than private sector workers are represented by union contracts. According to data from the Current Population Survey, in 2008, 35 percent of State government workers and 46 percent of local government workers were represented by union contracts, while only 8 percent of private sector workers were represented by union contracts.5 Union representation generally is positively correlated to higher pay and access to benefits.6 In recent years, for both public and private sector workers, there has been a considerable increase in employee access to wellness programs and employee assistance programs. The charts that follow show access rates for part-time and full-time public and private sector employees by a number of characteristics. In the charts that show historical comparisons, the data are for 1998 for the public sector and for 1999 for the private sector.7 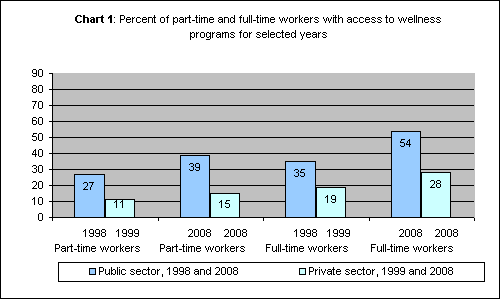
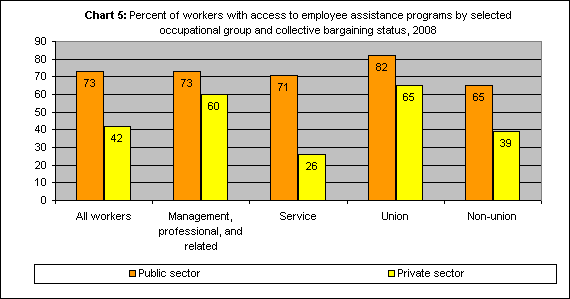
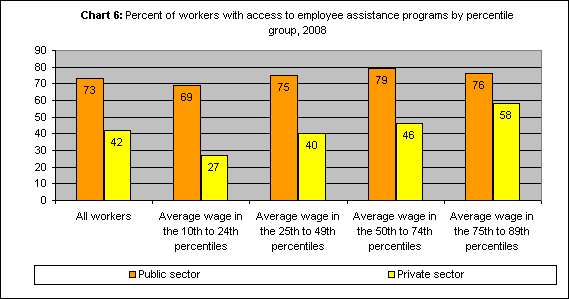
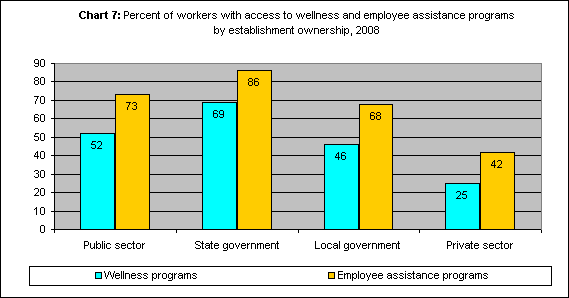
NOTE: For the 1998 and 1999 data used in this study, standard errors have not been calculated. Consequently, the inferences made using data from 1998 and 1999 cannot be verified by a statistical test. For the 2008 data, standard errors are available and the inferences made when comparing different elements of 2008 data have been verified. GlossaryWellness programs, as defined by NCS, offer employees two or more of the following benefits:
Employee assistance programs provide employee referral services or counseling concerning any of the following:
Exhibit 1.
|
| Occupational Group | State and local government | Private industry |
|---|---|---|
| All workers | 19,328,100 | 107,406,000 |
| Management, professional, and related |
10,619,000 | 24,528,900 |
| Service | 4,127,400 | 22,459,300 |
| Protective Service | 1,864,300 | Data not available |
The number of workers represented by the survey is rounded to the nearest 100. Estimates of the number of workers provide a description of size and composition of the labor force included in the survey. Estimates are not intended, however, for comparison to other statistical series to measure employment trends or levels. For more information on the data, see Employee Benefits in the United States, (Bureau of Labor Statistics, March 2008), appendix table 2; available on the Internet at http://www.bls.gov/ncs/ebs/home.htm.
Occupations are classified using the Standard Occupational Classification (SOC) system (available on the Internet at http://www.bls.gov/soc/home.htm). The SOC uses a six-digit hierarchical classification system that categorizes more than 800 individual occupations into 23 major groups.
1 Jeanne M. Lambrew, A Wellness Trust to Prioritize Disease Prevention (Brookings, April 2007); quote, p.14; available on the internet at www.hamiltonproject.org.
2 Carolyne Foster, “A Proactive Choice to Wellness,” OR Today, May 2007, pp. 32-35.
3 Workers represented in this study are public sector workers excluding Federal government workers, and workers in the private nonfarm economy excluding household workers and self-employed workers.
4 Ken McDonnell, “Benefit Cost Comparisons Between State and Local Governments and Private-Sector Employers,” EBRI Notes (Employee Benefits Research Institute, June 2008).
5 Labor Force Statistics from the Current Population Survey, Household Data Annual Averages, table 3, Union affiliation of employed wage and salary workers by occupation and industry. For more information, visit the CPS page on the BLS website at http://www.bls.gov/cps/.
The Current Population Survey defines workers “represented by unions” as union members, as well as workers who have no union affiliation but whose jobs are covered by a union or an employee association contract. About 1.7 million wage and salary workers were represented by a union on their main job in 2008, while not being union members themselves. About half of these workers were employed in government. For more information, see Union Members in 2008, USDL 09-0095 (U.S. Department of Labor) Jan. 28, 2009; available on the Internet at http://www.bls.gov/news.release/union2.toc.htm.
The National Compensation Survey defines union workers as workers whose wages are determined by a collective bargaining agreement. For more information, see National Compensation Survey: Occupational Earnings in the United States, 2007, Bulletin 2704 (Bureau of Labor Statistics, August 2008), available on the Internet at http://www.bls.gov/ncs/ncswage2007.htm.
6 See McDonnell, “Benefit Cost Comparisons Between State and Local Governments and Private-Sector Employers.”
7 As defined by the National Compensation Survey, an employee has access to a benefit plan if the employee is in an occupation that is offered the plan. By definition, either all employees in an occupation have access to a benefit or none has access. Historical data for both 1998 (public sector) and 1999 (private sector) are being used for this study because prior to 2000 surveys were conducted in alternating years on different sectors of the economy: public sector establishments were surveyed during even years and private sector establishments during odd years. In addition, in the 1998 survey of public sector workers, data for full-time employees were aggregated separately from data for part-time employees; an all worker aggregation was not published for public sector workers. This explains the use of the full-time workers category in charts 1 and 4. Beginning in 2000, benefits data were published annually for the private sector. The 2008 public sector benefits data used in this study, however, are only the second release of benefits data on State and local government workers since 1998.
8 Averages for occupations within an establishment were used to produce estimates for worker groups averaging hourly pay within the six earnings percentiles: Below the 10th percentile, 10th to under the 25th percentile, 25th to under the 50th percentile, 50th to under the 75th percentile, 75th to under the 90th percentile, and the 90th percentile and greater. Individual workers can fall into an earnings category different from the average for an occupation and establishment into which they are classified. The percentile breakouts are based on the average wage for each occupation surveyed, which may include workers both above and below the threshold. The percentile values are based on wages published in National Compensation Survey: Occupational Earnings in the United States, 2007, Bulletin 2704 (Bureau of Labor Statistics, August 2008), available on the Internet at http://www.bls.gov/ncs/ncswage2007.htm.
Tools |
Calculators |
Help |
Info |