Global Agricultural Monitoring
|
The U.S. Department of Agriculture (USDA) and the National Aeronautics and Space Administration (NASA) signed a Memorandum of Understanding (MOU) to strengthen collaboration. In support of this collaboration, NASA and the USDA Foreign Agricultural Service (FAS) jointly funded a new project to assimilate NASA's Moderate Resolution Imaging Spectroradiometer (MODIS) data and products into an existing decision support system (DSS) operated by the International Production Assessment Division (IPAD) of FAS. To meet its objectives, FAS/IPAD uses satellite data and data products to monitor agriculture worldwide and to locate and keep track of natural disasters such as short and long term droughts, floods and persistent snow cover which impair agricultural productivity. FAS is the largest user of satellite imagery in the non-military sector of the U.S. government. For the last 20 years FAS has used a combination of Landsat and NOAA-AVHRR satellite data to monitor crop condition and report on episodic events.
|
|
|
|
This animation shows where the world's food is grown versus where the world's food is consumed. The movie starts with global croplands and then fades to the countries that produce over 80% of the world's wheat, grain, and cereal. It then overlays the world's population density and then fades to show the countries that are projected to double and triple their population by 2050.
Duration: 26.0 seconds
Available formats:
512x288 (30 fps)
MPEG-1
461 KB
1280x720 (29.97 fps)
MPEG-4
4 MB
640x360 (30 fps)
MPEG-4
643 KB
640x360 (29.97 fps)
WMV
260 KB
1280x720 (30 fps)
Frames
1280x720 (30 fps)
Frames
1280x720 (30 fps)
Frames
1280x720 (60 fps)
Frames
320x180
PNG
116 KB
160x80
PNG
32 KB
80x40
PNG
10 KB
How to play our movies
|
|

|
|
This is the labeled version of this data visualization.
Duration: 27.0 seconds
Available formats:
640x360 (30 fps)
MPEG-4
839 KB
512x288 (30 fps)
MPEG-1
603 KB
1280x720 (29.97 fps)
MPEG-4
4 MB
1280x720 (60 fps)
Frames (Labels)
320x180
PNG
184 KB
How to play our movies
|
|

|
|
Cropland areas as seen by MODIS are colored yellow in this image. This shows the areas around the world where food is grown.
Available formats:
3840 x 2160
TIFF
6 MB
320 x 180
PNG
217 KB
|
|

|
|
Twenty six countries worldwide produce 82% of the world's wheat, grain, and cereals. These countries are shown in yellow.
Available formats:
3840 x 2160
TIFF
2 MB
320 x 180
PNG
161 KB
|
|

|
|
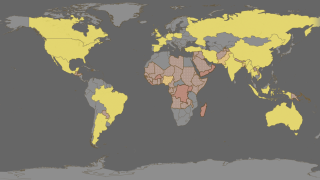
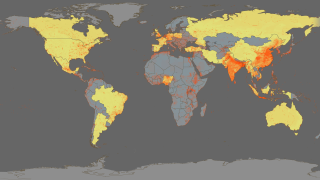
This image shows the world's largest producers of wheat, grain, and cereal in yellow versus the world's 2002 population density in red.
Available formats:
3840 x 2160
TIFF
3 MB
320 x 180
PNG
131 KB
|
|

|
|
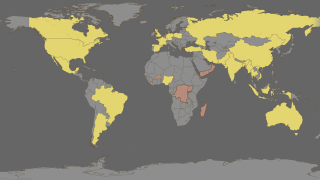
This image shows the biggest producers of wheat, grain versus the countries that are projected to double or triple their population by 2050. The red cross hatched areas are where significantly more food will be needed. Africa is in trouble.
Available formats:
3840 x 2160
TIFF
3 MB
320 x 180
PNG
170 KB
|
|

|
|
The United Nations is projecting the cross-hatched areas in light red to double their population. Yellow represents the countries that currently produce over 80% of the world's wheat, grain, and cereals.
Available formats:
3840 x 2160
TIFF
3 MB
320 x 180
PNG
169 KB
|
|
|
|
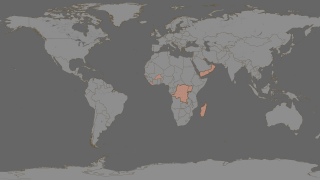
The United Nations is projecting the cross hatched areas to triple their population by 2050. Yellow shows the countries that currently produce over 80% of the world's wheat, grain, and cereals.
Available formats:
3840 x 2160
TIFF
2 MB
320 x 180
PNG
167 KB
|
|
|
|
The United Nations is projecting the cross hatched areas to triple their population by 2050.
Available formats:
3840 x 2160
TIFF
2 MB
320 x 180
PNG
162 KB
|
|
|
Back to Top
|

