Monitoring Agricultural Production from Space
|
Normalized Difference Vegetation Index (NDVI) maps allow comparisons of the spatial and temporal variability in the amount and condition of vegetation. The time series satellite derived NDVI was used to monitor and analyze changes in vegetation patterns in the major wheat production domain area in Australia. The NDVI comparison was done during the growing season, April through November, for 2002, 2005, and 2006 and it found that significant differences in vegetation growth production. These data and utilities are fundamental for crop yield forecasts and can serve as an early warning system for regions suffering from crop loss and food shortages. Wheat is Australia’s most important crop, with a seasonal gross value approaching 3 billion Australian dollars. Australia contributes between and 8 and 15% of world's wheat trade, making it the fourth largest exporter after the United States, Canada and the European Union. Severe drought in Australia not only decimating crops, but it also curtails exports and causes major price and trade impacts on global markets. In 2006, wheat exports dropped by a third from the year before which caused worldwide prices to soar to the highest levels in a decade.
|
|

|
|
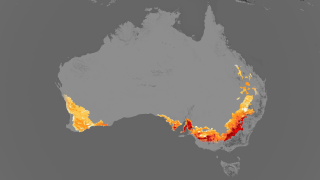
This animation shows the NDVI time series in the wheat producing regions in Australia for the growing season of two drought years and one normal year. The preview image is from the 2006 drought on Oct 18, 2006.
Duration: 40.0 seconds
Available formats:
3840x2160
TIFF
4 MB
320x180
PNG
195 KB
160x80
PNG
44 KB
80x40
PNG
12 KB
1280x720 (60 fps)
Frames
(GrowingSeasonApr Nov)
1280x720 (30 fps)
MPEG-4
16 MB
640x360 (30 fps)
MPEG-4
3 MB
1280x720 (30 fps)
Frames
How to play our movies
|
|

|
|
NDVI color table
Available formats:
320 x 90
PNG
6 KB
|
|
|
|
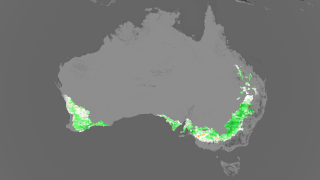
The NDVI for the wheat producing region during the growing season in a normal year. This image is from Oct 18, 2005.
Available formats:
3840 x 2160
TIFF
4 MB
320 x 180
PNG
194 KB
|
|
|
|
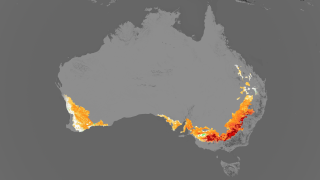
The NDVI for the wheat producing region during the growing season in 2002's drought year. This image is from Oct 18, 2002.
Available formats:
3840 x 2160
TIFF
1 MB
320 x 180
PNG
195 KB
|
|
|
|
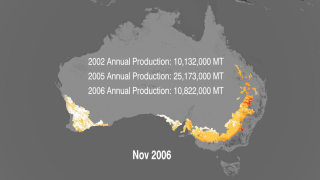
The final image shows the NDVI in the wheat producing region correlated with the annual wheat production. This image is from November 30, 2006 and the annual 2006 wheat production is 10,822,000 metric tons.
Available formats:
3840 x 2160
TIFF
4 MB
320 x 180
PNG
200 KB
|
|

|
|
The image shows the NDVI in the wheat producing region correlated with the annual wheat production during a normal year. This image is from November 30, 2005 and the annual 2005 wheat production is 25,173,000 metric tons.
Available formats:
3840 x 2160
TIFF
4 MB
320 x 180
PNG
198 KB
|
|
|
|
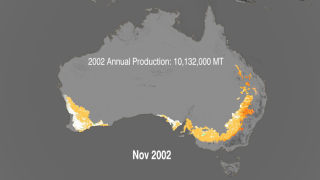
The image shows the NDVI in the wheat producing region correlated with the annual wheat production. This image is from November 30, 2002 and the annual 2002 wheat production is 10,132,000 metric tons.
Available formats:
3840 x 2160
TIFF
4 MB
320 x 180
PNG
200 KB
|
|
|
Back to Top
|

