Skip all navigation and jump to content Jump to site navigation Jump to section navigation.
NASA Logo - Goddard Space Flight Center + Visit NASA.gov
HOME PROJECTS RESOURCES SEARCH MAP

+ Advanced Search
Home
Home
View Most Recently Released Imagery
View Gallery of Imagery: A topical collection of SVS Imagery
Search Imagery by the keywords assigned to it
Search Imagery by the instruments that supplied data for a visualization product
Search Imagery by the series of visualizations that have been produced
Search Imagery by the scientist providing the data used in a visualization product
Search Imagery by the animator that created the product
Search Imagery by the identification number assigned to the visualization product
See other search options
Learn about the SVS Image Server
  + About the Server
  + Animation List
  + How to Use the Server


  + RSS Feeds
  + Podcasts


  + Opportunities
blank image
Previous Animation
Next Animation
Aqua/AIRS Sees Belt of Carbon Dioxide in Southern Hemisphere

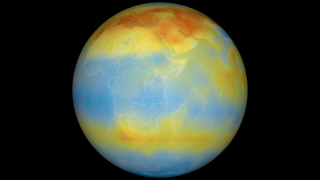
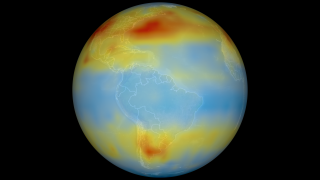
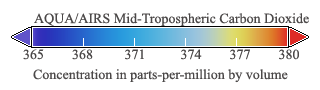
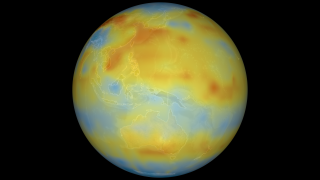
Although originally designed to measure atmospheric water vapor and temperature profiles for weather forecasting, data from the Atmospheric Infrared Sounder (AIRS) instrument on NASA's Aqua spacecraft are now also being used by scientists to observe atmospheric carbon dioxide. In the southern hemisphere, a belt of mid-tropospheric air containing enhanced concentrations of carbon dioxide emerged between 30 and 40 degrees south latitude. This belt had not previously been seen in any chemistry transport model. Subtropical storms track through this region, as do the cloud bands of the intertropical convergence zone near the equator, an area of low atmospheric pressure that forms where northeast and southeast trade winds meet.

The researchers believe strong convection (thunderstorms) in this belt, and South America's high Andes Mountains, lift carbon dioxide from major sources on Earth's surface, such as the respiration of plants, forest fires and facilities for producing synthetic fuels and generating power. This carbon dioxide is then carried into the 'free troposphere,' the part of the troposphere that is too high to be influenced by Earth's surface. There, it becomes trapped in the mid-latitude jet stream, which transports it rapidly around the world.

For more information on AIRS, visit the AIRS Project Web Site: http://airs.jpl.nasa.gov. The AIRS data products are available at http://daac.gsfc.nasa.gov/AIRS/index.shtml.


In the 1950's, the South African government decided to produce gasoline and chemicals from their plentiful natural supply of coal. The South African Coal liquidation plant also exports carbon dioxide. This image shows AIRS carbon dioxide data from July 2003.    In the 1950's, the South African government decided to produce gasoline and chemicals from their plentiful natural supply of coal. The South African Coal liquidation plant also exports carbon dioxide. This image shows AIRS carbon dioxide data from July 2003.

Available formats:
  3840 x 2160     TIFF 3 MB
  320 x 180         PNG     123 KB
  160 x 80           PNG       32 KB
  80 x 40             PNG         8 KB


Electrical plants in eastern Australia also export carbon dioxide to the mid-troposphere. This image shows AIRS carbon dioxide data from July 2003.    Electrical plants in eastern Australia also export carbon dioxide to the mid-troposphere. This image shows AIRS carbon dioxide data from July 2003.

Available formats:
  3840 x 2160     TIFF 3 MB
  320 x 180         PNG     123 KB


South America Biogenesis seen in AIRS carbon dioxide concentration data from July 2003.    South America Biogenesis seen in AIRS carbon dioxide concentration data from July 2003.

Available formats:
  3840 x 2160     TIFF 2 MB
  320 x 180         PNG     121 KB


Colortable for the carbon dioxide
   Colortable for the carbon dioxide

Available formats:
  320 x 90           PNG         8 KB

Animation Number:3554
Completed:2008-09-05
Animators:Lori Perkins (NASA/GSFC) (Lead)
 Greg Shirah (NASA/GSFC)
Scientists:Moustafa Chahine (NASA/JPL)
 Tom Pagano (NASA/JPL CalTech)
 Edward Olsen (NASA/JPL CalTech)
Platforms/Sensors/Data Sets:Aqua/AIRS
 Aqua/AIRS/Wind
Data Collected:2003/07/01-31
Series:COGlobalTransport
Keywords:
DLESE >> Atmospheric science
SVS >> Carbon Dioxide
DLESE >> Chemistry
SVS >> HDTV
SVS >> Volume
GCMD >> EARTH SCIENCE >> Atmosphere >> Atmospheric Chemistry
GCMD >> EARTH SCIENCE >> Atmosphere >> Atmospheric Chemistry/Carbon and Hydrocarbon Compounds
This work has been visible on
Feature article at http://www.terra-marin.com/articles/greengov.php
 
 
Please give credit for this item to
NASA/Goddard Space Flight Center and NASA/Jet Propulsion Laboratory Scientific Visualization Studio


Back to Top

USA.gov logo - the U.S. Government's official Web portal. + Privacy Policy and Important Notices
+ Reproduction Guidelines
NASA NASA Official:
SVS Contact:
Curator: