Skip all navigation and jump to content Jump to site navigation Jump to section navigation.
NASA Logo - Goddard Space Flight Center + Visit NASA.gov
HOME PROJECTS RESOURCES SEARCH MAP

+ Advanced Search
Home
Home
View Most Recently Released Imagery
View Gallery of Imagery: A topical collection of SVS Imagery
Search Imagery by the keywords assigned to it
Search Imagery by the instruments that supplied data for a visualization product
Search Imagery by the series of visualizations that have been produced
Search Imagery by the scientist providing the data used in a visualization product
Search Imagery by the animator that created the product
Search Imagery by the identification number assigned to the visualization product
See other search options
Learn about the SVS Image Server
  + About the Server
  + Animation List
  + How to Use the Server


  + RSS Feeds
  + Podcasts


  + Opportunities
blank image
Previous Animation
Next Animation
Sequence of Clouds, Snow Cover, Sea Ice, Sea Surface Temperature and Biosphere

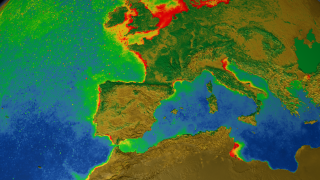
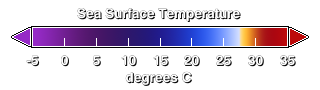
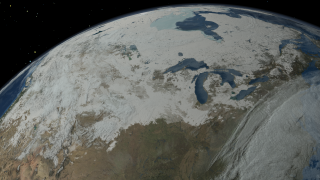
This animation is part of an NSF-funded, international project, Exploring Time. The two-hour television special, broadcast on the Discovery Channel in the spring of 2007, explores how the world changes over different timescales ... from billionths of seconds to billions of years. This animation portrays a variety of remotely sensed data elements at different temporal resolutions.

Initially, the animation shows cloud cover in motion over North America in half-hour increments from Nov. 26 to Dec. 7, 2005. The temporal pace quickens to show a 5-day moving average of daily MODIS snow cover along with daily AMSR-E sea ice from Dec. 7, 2005 to Mar. 15, 2006. As the view swings south over the Gulf of Mexico, the AMSR-E Sea Surface Temperature reveals warming ocean temperatures from March through August, 2006. As it passes over the Atlantic Ocean, the biosphere fades into view, showing both chlorophyll concentration in the ocean along with Normalized Difference Vegetation Index over the land areas. The biosphere animates over time while the view pans over northern Africa and Europe, showing data collected from September 2002 through February 2006.

This program was also broadcast in Japan through a partnership with the NHK international broadcasting service and in France through a partnership with the ARTE television network.


This animation shows snow cover, sea ice, clouds, sea surface temperature and biosphere while the view moves from North America across the Atlantic Ocean to Northern Africa and Europe.    This animation shows snow cover, sea ice, clouds, sea surface temperature and biosphere while the view moves from North America across the Atlantic Ocean to Northern Africa and Europe.
Duration: 36.0 seconds
Available formats:
  1280x720 (29.97 fps) Frames
  512x288 (29.97 fps) MPEG-1   12 MB
  1280x720 (29.97 fps) MPEG-2   73 MB
  640x360 (29.92 fps) MPEG-4   6 MB
  1280x720 (29.97 fps) MPEG-4   29 MB
  1280x720 (59.94 fps) Frames
  160x80       PNG           19 KB
  80x40         PNG           5 KB
  320x180     PNG           84 KB
How to play our movies


This image shows snow cover, sea ice and clouds over North America on 12/5/2005.    This image shows snow cover, sea ice and clouds over North America on 12/5/2005.

Available formats:
  2560 x 1440     TIFF 4 MB
  320 x 180         PNG       89 KB


This images shows sea surface temperature over the Gulf of Mexico on 6/16/2006.
   This images shows sea surface temperature over the Gulf of Mexico on 6/16/2006.

Available formats:
  2560 x 1440     TIFF 2 MB
  320 x 180         PNG       65 KB


This image shows the biosphere over Europe and northern Africa on 11/2/2005.    This image shows the biosphere over Europe and northern Africa on 11/2/2005.

Available formats:
  2560 x 1440     TIFF 6 MB
  320 x 180         PNG     108 KB


This color bar denotes the values of the sea surface temperature.
   This color bar denotes the values of the sea surface temperature.

Available formats:
  320 x 90           PNG       13 KB


This color bar denotes the values of the chlorophyll concentration.
   This color bar denotes the values of the chlorophyll concentration.

Available formats:
  320 x 90           PNG       12 KB


This color bar shows the Normalized Difference Vegetation Index colors ranging from brown (low) to bright green (high).
   This color bar shows the Normalized Difference Vegetation Index colors ranging from brown (low) to bright green (high).

Available formats:
  320 x 90           PNG       13 KB

Animation Number:3383
Completed:2006-11-29
Animators:Cindy Starr (GST) (Lead)
 Greg Shirah (NASA/GSFC)
 Alex Kekesi (GST)
 Tom Bridgman (GST)
Platforms/Sensors/Data Sets:Aqua/AMSR-E
 GOES/IR4
 NOAA/AVHRR
 Terra/MODIS
 Aqua/AMSR-E/Daily L3 6.25 km 89 GHz Brightness Temperature (Tb)
 Aqua/AMSR-E/Daily L3 12.5km Tb, Sea Ice Concentration, and Snow Depth
 Aqua/AMSR-E/Sea Surface Temperature
 NOAA-14/AVHRR/Fires
 Terra/MOPITT/CO Mixing Ratio
 Terra and Aqua/MODIS/Blue Marble Land Cover
 TOPEX/Poseidon/Sea Surface Height Anomaly
Data Collected:GOES clouds 2005-11-26 to 2005-12-20; MODIS snow 2005-11-26 to 2006-04-01; AMSR-E 89 GHz Brightness Temperature (Tb) 2005-11-26 to 2006-04-01; AMSR-E Sea Ice Concentration 2005-11-26 to 2006-04-01; AMSR-E Sea Surface Temperature 2006-01-04 to 2006-10-17; Normalized Difference Vegetation Index 2002-09-24 to 2006-03-05; AVHRR 2002-09-24 to 2006-03-05
Keywords:
DLESE >> Atmospheric science
SVS >> Biosphere
SVS >> Clouds
DLESE >> Cryology
SVS >> HDTV
DLESE >> Physical oceanography
GCMD >> EARTH SCIENCE >> Atmosphere >> Clouds
GCMD >> EARTH SCIENCE >> Biosphere >> Vegetation
GCMD >> EARTH SCIENCE >> Oceans >> Ocean Temperature
GCMD >> EARTH SCIENCE >> Oceans >> Sea Ice
GCMD >> EARTH SCIENCE >> Cryosphere >> Sea Ice >> Ice Extent
GCMD >> EARTH SCIENCE >> Cryosphere >> Sea Ice >> Sea Ice Concentration
GCMD >> EARTH SCIENCE >> Cryosphere >> Sea Ice >> Sea Ice Motion
GCMD >> EARTH SCIENCE >> Cryosphere >> Snow/Ice >> Ice Extent
GCMD >> EARTH SCIENCE >> Cryosphere >> Snow/Ice >> Ice Growth/Melt
GCMD >> EARTH SCIENCE >> Cryosphere >> Snow/Ice >> Snow Cover
 
 
Please give credit for this item to
NASA/Goddard Space Flight Center Scientific Visualization Studio
The Blue Marble data is courtesy of Reto Stockli (NASA/GSFC).


Back to Top

USA.gov logo - the U.S. Government's official Web portal. + Privacy Policy and Important Notices
+ Reproduction Guidelines
NASA NASA Official:
SVS Contact:
Curator: