Fall and Winter Arctic Sea Ice Thickness Declining Rapidly
|
|
Using five years of data from NASA's Ice, Cloud and land Elevation Satellite (ICESat), a team of NASA and university scientists made the first basin-wide estimate of the thickness and volume of the Arctic Ocean ice cover between 2003 and 2008. The scientists found that younger, thinner ice has replaced older, thicker ice as the dominant type over the past five years. Until recently, the majority of Arctic ice survived at least one summer and often several. That balance has now flipped. Seasonal ice, or ice that melts and re-freezes every year, now comprises about 70 percent of the Arctic sea ice in wintertime, up from 40 to 50 percent in the 1980s and 1990s. Thicker ice — surviving two or more years — now comprises just 10 percent of ice cover, down from 30 to 40 percent in years past.Sea ice thickness has been hard to measure directly so scientists have typically used estimates of ice age to approximate thickness. With ICESat, NASA scientists were for the first time able to monitor the ice thickness and volume changes over the entire Arctic Ocean. The Arctic ice cap grows each winter as the sun sets for several months and intense cold sets in. The total volume of winter Arctic ice is equal to the volume of fresh water in Lake Superior and Lake Michigan combined. Some of that ice is naturally pushed out of the Arctic by winds, while much of it melts in place. But not all of the ice in the Arctic melts each summer, and the thicker, older ice that survives one or more summers is more likely to persist through the next summer. This older, thicker ice is declining thinner ice that is more vulnerable to summer melt. Seasonal sea ice usually reaches about 2 meters (6 feet) in thickness, while ice that has lasted through more than one summer averages 3 meters (9 feet), though it can grow much thicker in some locations near the coast. From 2003 to 2008, multi-year ice has thinned by an average of 60 centimeters (2 feet). The total ice volume in winter has decreased by 6,300 cubic kilometers, or 40 percent. The maximum extent of multi-year ice is now one-third of what it was in the 1990s.
|
|

|
|
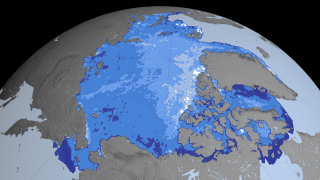
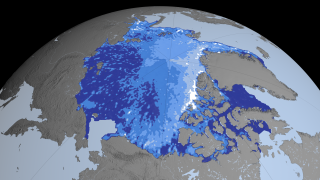
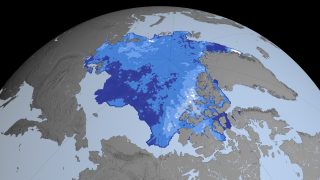
This sequence shows Arctic sea ice thickness derived from winter and fall campaigns from the ICESat satellite. Sea ice grows extent grows in the summer and shrinks in the winter. While the sea ice extent might look similar from year to year this thickness data shows dramatic thinning especially near the North Pole (shown in dark blue). This image was generated with data acquired between Feb 17 - Mar 21, 2008.
Duration: 32.0 seconds
Available formats:
1280x720 (30 fps)
MPEG-4
27 MB
160x80
PNG
59 KB
80x40
PNG
15 KB
320x180
PNG
243 KB
3840x2160
TIFF
8 MB
1280x720 (30 fps)
Frames
1280x720 (60 fps)
Frames
640x360 (29.97 fps)
WMV
2 MB
640x360 (30 fps)
MPEG-4
5 MB
512x288 (30 fps)
MPEG-1
2 MB
How to play our movies
|
|

|
|
Colorbar in meters
Available formats:
320 x 90
PNG
8 KB
|
|

|
|
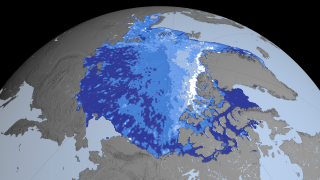
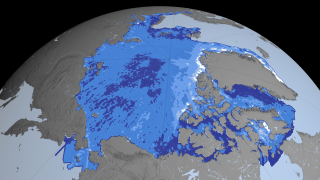
Watch how the sea ice has changed over the summer. This image was taken with data from Oct 4 - Oct 19, 2008.
Available formats:
3840 x 2160
TIFF
7 MB
160 x 80
PNG
58 KB
80 x 40
PNG
15 KB
320 x 180
PNG
234 KB
|
|
|
|
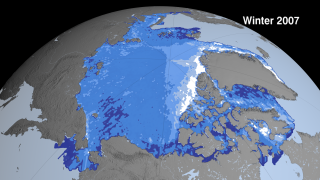
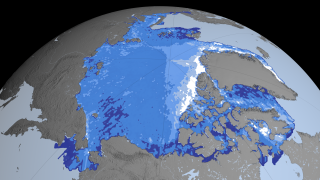
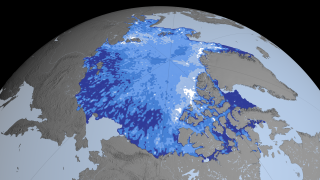
The sea ice grows in winter. This image is taken with data between Mar 12 - Apr 14, 2007.
Available formats:
320 x 180
PNG
241 KB
3840 x 2160
TIFF
8 MB
|
|
|
|
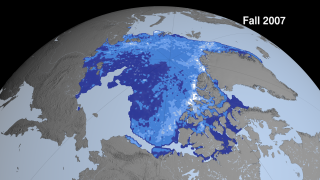
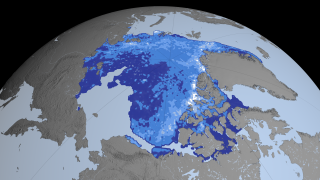
Watch how the sea ice has changed over the summer. This image was taken with data from Oct 2 - Nov 5, 2007.
Available formats:
3840 x 2160
TIFF
7 MB
320 x 180
PNG
237 KB
|
|

|
|
Feb 22 - Mar 28, 2006
Available formats:
320 x 180
PNG
241 KB
3840 x 2160
TIFF
8 MB
|
|

|
|
Fall thickness image: Oct 25 - Nov 27, 2006
Available formats:
3840 x 2160
TIFF
8 MB
320 x 180
PNG
239 KB
|
|

|
|
Winter thickness image: Feb 17 - Mar 24, 2005
Available formats:
320 x 180
PNG
241 KB
3840 x 2160
TIFF
8 MB
|
|

|
|
Fall thickness image: Oct 21 - Nov 24, 2005
Available formats:
3840 x 2160
TIFF
8 MB
320 x 180
PNG
240 KB
|
|

|
|
Winter thickness image: Feb 18 - Mar 21, 2004
Available formats:
320 x 180
PNG
242 KB
3840 x 2160
TIFF
8 MB
|
|

|
|
Fall thickness image: Oct 4 - Nov 8, 2004
Available formats:
3840 x 2160
TIFF
8 MB
320 x 180
PNG
238 KB
|
|

|
|
Winter thickness image: Feb 20 - Mar 29, 2003
Available formats:
320 x 180
PNG
241 KB
3840 x 2160
TIFF
8 MB
|
|
|
|
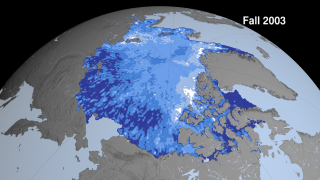
Fall thickness image: Oct 4 - Nov 18, 2003
Available formats:
3840 x 2160
TIFF
8 MB
320 x 180
PNG
240 KB
|
|
|
|
Winter image from data acquired between Feb 20 - Mar 29, 2003 without the date overlay.
Available formats:
320 x 180
PNG
238 KB
3840 x 2160
TIFF
8 MB
|
|

|
|
Image acquired from data between Oct 4 - Nov 18, 2003 without date overlay.
Available formats:
3840 x 2160
TIFF
8 MB
320 x 180
PNG
238 KB
|
|

|
|
Image created from data between Feb 18 - Mar 21, 2004 without the date overlay.
Available formats:
320 x 180
PNG
239 KB
3840 x 2160
TIFF
8 MB
|
|

|
|
Fall Image from Oct 4 - Nov 8, 2004 without the date overlay.
Available formats:
3840 x 2160
TIFF
7 MB
320 x 180
PNG
236 KB
|
|

|
|
Winter image from Feb 17 - Mar 24, 2005 without the date overlay.
Available formats:
320 x 180
PNG
238 KB
3840 x 2160
TIFF
8 MB
|
|
|
|
Fall image from Oct 21 - Nov 24, 2005 without the date overlay.
Available formats:
3840 x 2160
TIFF
8 MB
320 x 180
PNG
237 KB
|
|

|
|
Winter image from Feb 22 - Mar 28, 2006 without the date overlay.
Available formats:
320 x 180
PNG
238 KB
3840 x 2160
TIFF
8 MB
|
|
|
|
Fall image from Oct 25 - Nov 27, 2006 without the date overlay.
Available formats:
3840 x 2160
TIFF
7 MB
320 x 180
PNG
237 KB
|
|
|
|
Winter image from Mar 12 - Apr 14, 2007 without the date overlay.
Available formats:
320 x 180
PNG
239 KB
3840 x 2160
TIFF
8 MB
|
|
|
|
Fall image from Oct 2 - Nov 5, 2007 without the date overlay.
Available formats:
3840 x 2160
TIFF
7 MB
320 x 180
PNG
234 KB
|
|

|
|
Winter image from Feb 17 - Mar 21, 2008 without the date overlay.
Available formats:
320 x 180
PNG
240 KB
3840 x 2160
TIFF
8 MB
|
|
|
|
Fall image from Oct 4 - Oct 19, 2008 without the date overlay.
Available formats:
3840 x 2160
TIFF
7 MB
320 x 180
PNG
231 KB
|
|
|
Back to Top
|

