Skip all navigation and jump to content Jump to site navigation Jump to section navigation.
NASA Logo - Goddard Space Flight Center + Visit NASA.gov
HOME PROJECTS RESOURCES SEARCH MAP

+ Advanced Search
Home
Home
View Most Recently Released Imagery
View Gallery of Imagery: A topical collection of SVS Imagery
Search Imagery by the keywords assigned to it
Search Imagery by the instruments that supplied data for a visualization product
Search Imagery by the series of visualizations that have been produced
Search Imagery by the scientist providing the data used in a visualization product
Search Imagery by the animator that created the product
Search Imagery by the identification number assigned to the visualization product
See other search options
Learn about the SVS Image Server
  + About the Server
  + Animation List
  + How to Use the Server


  + RSS Feeds
  + Podcasts


  + Opportunities
blank image
Previous Animation
Next Animation
Solar Variability and Total Solar Irradiance (TSI)

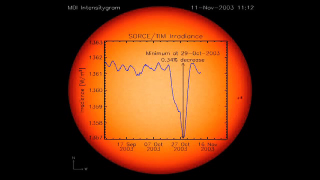
Analyzing the Sun and its affects on climate is complicated by the fact that the amount of radiation arriving from the Sun is not constant. It varies from the average value of the total solar irradiance (TSI)--1,361 W/m2--on a daily basis. Variations in TSI are due to a balance between decreases caused by sunspots and increases caused by faculae, which are the bright areas that surround sunspots. The Sun's energy output varies with time, and Glory's TIM instrument will help measure those fluctuations by continued monitoring of TSI data. Data from Glory's TIM instrument will extend the long-term climate record, which has been uninterrupted since 1978 and provides the best estimate available of solar inputs to climate. This short movie displays the Sun rotating and the corresponding total solar irradiance.

This data is from October 2003, and displays the largest recorded short-term decrease in TSI. Video courtesy of Laboratory for Atmospheric and Space Physics.    This data is from October 2003, and displays the largest recorded short-term decrease in TSI. Video courtesy of Laboratory for Atmospheric and Space Physics.
Duration: 1.9 minutes
Available formats:
  1024x938   Frames
  640x360 (29.97 fps) MPEG-1   15 MB
  512x288 (29.97 fps) MPEG-1   10 MB
  320x180 (15 fps) MPEG-4   2 MB
  1280x720 (30 fps) QT         37 MB
  1024x1024 (30 fps) MPEG-1   61 MB
  320x180     PNG           111 KB
  160x80       PNG           33 KB
  80x40         PNG           9 KB
How to play our movies

Animation Number:10396
Completed:2009-02-19
Producer:Maria Frostic (UMBC)
Scientist:Greg Kopp (Laboratory for Atmospheric and Space Physics)
Goddard TV Tape:G2008-047 -- Glory Resource Reel
Keywords:
SVS >> HDTV
SVS >> Solar Cycle
SVS >> Sun
GCMD >> EARTH SCIENCE >> Sun-earth Interactions
GCMD >> EARTH SCIENCE >> Atmosphere >> Atmospheric Radiation >> Solar Irradiance
GCMD >> EARTH SCIENCE >> Sun-earth Interactions >> Solar Activity >> Solar Irradiance
SVS >> Glory
More Information on this topic available at:
http://glory.gsfc.nasa.gov
 
 
Please give credit for this item to
Laboratory for Atmospheric and Space Physics.


Back to Top

USA.gov logo - the U.S. Government's official Web portal. + Privacy Policy and Important Notices
+ Reproduction Guidelines
NASA NASA Official:
Content Contact:
Curator: