|
How much greenhouse gas emissions can I save by switching from driving alone to taking existing public transportation?
By switching from driving alone to taking existing public transportation, you can completely eliminate the emissions you would have produced while driving - the bus or train you take will run regardless! The load of an additional passenger has a negligible impact on the energy efficiency and greenhouse gas emissions of a bus or train.
Use the carbon calculator below to estimate your greenhouse gas emissions savings from taking public transportation rather than driving.
The following calculator only provides an estimate, and should not be used as official data.
Why is this important?
According to the Intergovernmental Panel on Climate Change (IPCC)  , human activities, primarily the burning of fossil fuels, are causing global warming. The IPCC’s latest report lists several projected impacts of climate change, including sea level rise, more extreme weather, biodiversity loss, agricultural production changes, and water supply stress. The report represents the consensus of world’s leading climate scientists and was approved by member governments, including the United States. The report concludes that carbon dioxide emissions and other greenhouse gas emissions must be significantly reduced in order to avoid many of the impacts of climate change. , human activities, primarily the burning of fossil fuels, are causing global warming. The IPCC’s latest report lists several projected impacts of climate change, including sea level rise, more extreme weather, biodiversity loss, agricultural production changes, and water supply stress. The report represents the consensus of world’s leading climate scientists and was approved by member governments, including the United States. The report concludes that carbon dioxide emissions and other greenhouse gas emissions must be significantly reduced in order to avoid many of the impacts of climate change.
How significant is my savings?
The average American produces 20 tons of CO2 per year, or 121 pounds per day. So, by taking existing transit rather than driving alone, for a daily commute of 10 miles each way, a person would save 4,600 pounds of CO2 per year (based on 240 working days per year). That is 2.1 metric tons1, or about a 10% reduction in carbon footprint. By comparison, weatherizing their home and adjusting their thermostat would save a person about 2,800 pounds of CO2 per year.
How is the result calculated?
The calculator carries out the following calculation:
Pounds CO2= trip distance in miles x 19.564 pounds CO2 per gallon1 / miles per gallon for average personal vehicle2
For example:
10 mile trip x 19.564 pounds CO2 per gallon / 20.3 miles per gallon for average personal vehicle = 9.6 pounds CO2
[1] For motor gasoline. Source: United States Department of Energy, Energy Information Administration, Voluntary Reporting of Greenhouse Gases Program, Fuel and Energy Source Codes and Emission Coefficients, http://www.eia.doe.gov/oiaf/1605/coefficients.html, downloaded December 19, 2007.
[2] 20.3 miles per gallon was the average fuel economy for the in-use fleet of all light-duty vehicles in 2003 according to EPA. Source: United States Environmental Protection Agency, Greenhouse Gas Emissions from the U.S. Transportation Sector, 1990-2003, March 2006, p17.
|
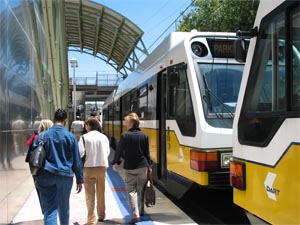 Riders exiting a light rail vehicle. Taking transit can reduce greenhouse gas emissions one would emit when driving alone.
|


