April 28, 2009
(The Editor’s Desk is updated each business day.)
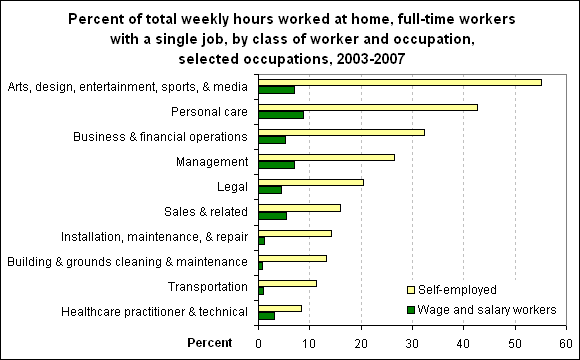
Which workers spend the most time working at home?
Self-employed workers spent a larger percent of their total weekly work hours at home than did wage and salary workers in 2003-07 — 24 percent compared with 4 percent.
[Chart data—TXT]
The largest difference between self-employed and wage and salary workers occurred among arts, design, entertainment, sports, and media occupations. Self-employed workers in these occupations worked about 55 percent of their total weekly work hours at home, compared with only 7 percent for wage and salary workers.
Self-employed workers in personal care occupations, which include childcare workers, also worked a large share of their total weekly work hours at home (about 43 percent), compared with 9 percent for wage and salary workers in these occupations.
Self-employed workers in every occupational group worked a larger percentage of their total weekly work hours at home than did wage and salary workers.
These data are from the American Time Use Survey program. To learn more, see "Work-at-home patterns by occupation" (PDF), Issues in Labor Statistics, Summary 09-02, March 2009.
|

