Skip all navigation and jump to content Jump to site navigation Jump to section navigation.
NASA Logo - Goddard Space Flight Center + Visit NASA.gov
HOME PROJECTS RESOURCES SEARCH MAP

+ Advanced Search
Home
Home
View Most Recently Released Imagery
View Gallery of Imagery: A topical collection of SVS Imagery
Search Imagery by the keywords assigned to it
Search Imagery by the instruments that supplied data for a visualization product
Search Imagery by the series of visualizations that have been produced
Search Imagery by the scientist providing the data used in a visualization product
Search Imagery by the animator that created the product
Search Imagery by the identification number assigned to the visualization product
See other search options
Learn about the SVS Image Server
  + About the Server
  + Animation List
  + How to Use the Server


  + RSS Feeds
  + Podcasts


  + Opportunities
blank image
Previous Animation
Next Animation
Missing Carbon: CO2 Growth in the last 400,000 Years

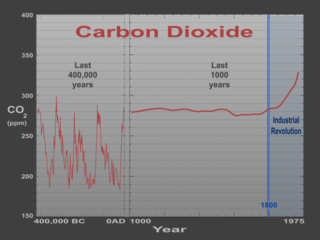
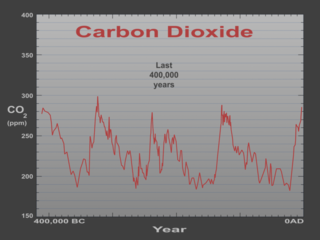
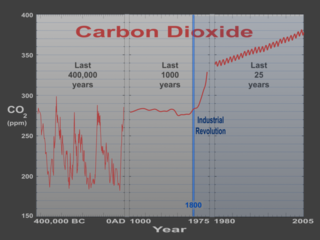
The animation shows a graph of carbon dioxide (on the y-axis) versus time (on the x-axis). First data is shown from about the last 400,000 years. Next, this graph slides to the left and a new graph slides on showing carbon dioxide from the last 1000 years. NOTE: the y-axis scale remains the same. Finally, a graph showing carbon dioxide from 1980 to 2005 is shown. The industrial revolution is shown as a blue line. Lake Vostok ice cores provide data from about 400,000 BC to about 4000 BC; Law Dome ice cores provide data from 1010 AD to 1975 AD; Mauna Loa observations provide data from 1980 to 2005.

Carbon Dioxide graphs from the last 400,000; 1000; and 25 year ranges    Carbon Dioxide graphs from the last 400,000; 1000; and 25 year ranges
Duration: 15.0 seconds
Available formats:
  640x480 (30 fps) MPEG-1   7 MB
  720x480 (29.97 fps) MPEG-2   11 MB
  1280x720 (29.97 fps) Frames
  640x480 (29.97 fps) Frames
  320x240     PNG           60 KB
  160x80       PNG           12 KB
  80x40         PNG           3 KB
  1280x720 (29.97 fps) MPEG-2   33 MB
  320x240 (29.97 fps) MPEG-1   2 MB
  1280x720 (29.97 fps) MPEG-4   3 MB
  320x240 (29.97 fps) X-FLV       649 KB
How to play our movies


Carbon Dioxide graph from the last 400,000 years    Carbon Dioxide graph from the last 400,000 years

Available formats:
  1280 x 960       TIFF   922 KB
  320 x 240         PNG       38 KB


Carbon Dioxide graph from the last 1000 years (includes last 400,000 year graph)    Carbon Dioxide graph from the last 1000 years (includes last 400,000 year graph)

Available formats:
  1280 x 960       TIFF 1003 KB
  320 x 240         PNG       42 KB


Carbon Dioxide graph from the last 25 year (includes last 400,000 and 1000 year graphs)    Carbon Dioxide graph from the last 25 year (includes last 400,000 and 1000 year graphs)

Available formats:
  1280 x 960       TIFF 1 MB
  320 x 240         PNG       47 KB

Animation Number:3307
Completed:2005-11-14
Animator:Greg Shirah (NASA/GSFC) (Lead)
Scientist:Jim Collatz (NASA/GSFC)
Platforms/Sensors/Data Sets:Carbon Dioxide from Lake Vostok Ice Core (411,005 BC to 3674 BC)
 Carbon Dioxide from Lawdome Ice Core (1010 AD to 1975 AD)
 Carbon Dioxide from Mauna Loa Measurements (1980 to 2005)
Series:Missing Carbon
Goddard TV Tape:G2007-001HD -- NASA's HD Climate Change Resource Tape
Keywords:
SVS >> Carbon Dioxide
SVS >> HDTV
GCMD >> EARTH SCIENCE >> Atmosphere >> Atmospheric Chemistry/Carbon and Hydrocarbon Compounds >> Carbon Dioxide
GCMD >> EARTH SCIENCE >> Paleoclimate >> Ice Core Records >> Carbon Dioxide
 
 
Please give credit for this item to
NASA/Goddard Space Flight Center Scientific Visualization Studio


Back to Top

USA.gov logo - the U.S. Government's official Web portal. + Privacy Policy and Important Notices
+ Reproduction Guidelines
NASA NASA Official:
SVS Contact:
Curator: