Leukemia Rates by State
In the following maps, the U.S. states are divided into groups based on the rates at which people developed or died from leukemia in 2005, which is the most recent year with numbers available. The rates are the numbers out of 100,000 people who developed or died from leukemia each year.
Incidence of Leukemia by State
Leukemia Incidence Rates* by State, 2005†
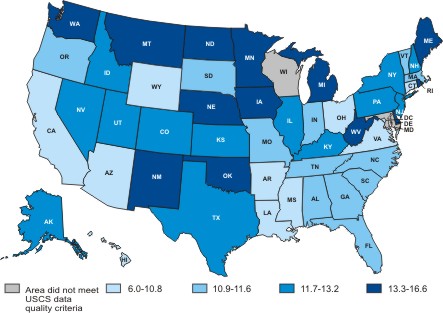
| Color on Map | Interval | States |
|---|---|---|
| Light blue | 6.0 to 10.8 | Arizona, Arkansas, California, Connecticut, the District of Columbia, Hawaii, Louisiana, Mississippi, Ohio, Virginia, and Wyoming |
| Medium blue | 10.9 to 11.6 | Alabama, Florida, Georgia, Indiana, Massachusetts, Missouri, North Carolina, Oregon, South Carolina, South Dakota, Tennessee, and Vermont |
| Royal blue | 11.7 to 13.2 | Alaska, Colorado, Idaho, Illinois, Kansas, Kentucky, Nevada, New Hampshire, New Jersey, New York, Pennsylvania, Texas, and Utah |
| Dark blue | 13.3 to 16.6 | Delaware, Iowa, Maine, Michigan, Minnesota, Montana, Nebraska, New Mexico, North Dakota, Oklahoma, Rhode Island, Washington, and West Virginia |
| Light Grey | Did not meet USCS data quality criteria | Maryland and Wisconsin |
*Rates are per 100,000 and are age-adjusted to the 2000 U.S. standard population.
†Source: U.S. Cancer Statistics Working Group. United States Cancer Statistics: 1999–2005 Incidence and Mortality Web-based Report. Atlanta (GA): Department of Health and Human Services, Centers for Disease Control and Prevention, and National Cancer Institute; 2009. Available at: http://www.cdc.gov/uscs.
Deaths from Leukemia by State
Leukemia Death Rates* by State, 2005†
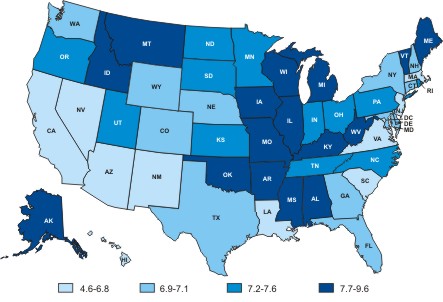
| Color on Map | Interval | States |
|---|---|---|
| Light blue | 4.6 to 6.8 | Arizona, the District of Columbia, California, Hawaii, Louisiana, Massachusetts, Nevada, New Jersey, New Mexico, South Carolina, and Virginia |
| Medium blue | 6.9 to 7.1 | Colorado, Connecticut, Delaware, Florida, Georgia, Maryland, Nebraska, New Hampshire, New York, Texas, Washington, and Wyoming |
| Royal blue | 7.2 to 7.6 | Indiana, Kansas, Minnesota, North Carolina, North Dakota, Ohio, Oregon, Pennsylvania, Rhode Island, South Dakota, Tennessee, and Utah |
| Dark blue | 7.7 to 9.6 | Alabama, Alaska, Arkansas, Idaho, Illinois, Iowa, Kentucky, Maine, Michigan, Mississippi, Missouri, Montana, Oklahoma, Vermont, West Virginia, and Wisconsin |
*Rates are per 100,000 and are age-adjusted to the 2000 U.S. standard population.
†Source: U.S. Cancer Statistics Working Group. United States Cancer Statistics: 1999–2005 Incidence and Mortality Web-based Report. Atlanta (GA): Department of Health and Human Services, Centers for Disease Control and Prevention, and National Cancer Institute; 2009. Available at: http://www.cdc.gov/uscs.
References
1U.S. Cancer Statistics Working Group. United States Cancer Statistics: 1999–2005 Incidence and Mortality Web-based Report. Atlanta (GA): Department of Health and Human Services, Centers for Disease Control and Prevention, and National Cancer Institute; 2009. Available at: http://www.cdc.gov/uscs.
2Jemal A, Thun MJ, Ries LA, Howe HL, Weir HK, Center MM, Ward E, Wu XC, Eheman C, Anderson R, Ajani UA, Kohler B, Edwards BK. Annual report to the nation on the status of cancer, 1975–2005, featuring trends in lung cancer, tobacco use, and tobacco control. Journal of the National Cancer Institute 2008;100(23):1672–1694.
Contact Us:
- Centers for Disease Control and Prevention
Division of Cancer Prevention and Control
4770 Buford Hwy NE
MS K-64
Atlanta, GA 30341 - 800-CDC-INFO
(800-232-4636)
TTY: (888) 232-6348
24 Hours/Every Day - cdcinfo@cdc.gov
