Prostate Cancer Rates by Race and Ethnicity
Prostate cancer rates differ for different racial and ethnic populations. Differences in prostate cancer death rates as of 2005 (the most recent year for which statistics are currently available) are shown in the graphs below.
Rate of Prostate Cancer by Race and Ethnicity
"Incidence rate" means how many men out of a given number get the disease each year. The graph below shows how many men out of 100,000 got prostate cancer each year during the years 1975–2005. The year 2005 is the most recent year for which numbers have been reported. The prostate cancer incidence rate is grouped by race and ethnicity.
For example, you can see that black men had the highest incidence rate for prostate cancer. White men had the second highest incidence of getting prostate cancer, followed by Hispanic, Asian/Pacific Islander, and American Indian/Alaska Native men.
Prostate Cancer SEER Incidence Rates* by Race and Ethnicity, U.S., 1975–2005
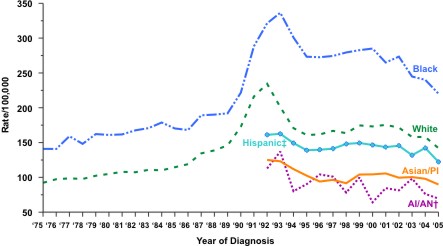
Incidence source: Surveillance, Epidemiology, and End Results (SEER) Program, National Cancer Institute (NCI) 1975–1991 = SEER 9; 1992–2005 = SEER 13.
*Rates are per 100,000 and are age-adjusted to the 2000 U.S. standard population (19 age groups - Census P25-1130).
†Rates for American Indians/Alaska Natives are based on the CHSDA (Contract Health Service Delivery Area) counties.
‡Hispanics are not mutually exclusive from whites, blacks, Asians/Pacific Islanders, and American Indians/Alaska Natives. Incidence data for Hispanics are based on NHIA and exclude cases from the Alaska Native Registry.
Deaths from Prostate Cancer by Race and Ethnicity
From 1975–2005, the rate of men dying from prostate cancer has varied, depending on their race and ethnicity. The graph below shows that in 2005, black men were more likely to die of prostate cancer than any other group. White men had the second highest rate of deaths from prostate cancer, followed by men who are American Indian/Alaska Native, Hispanic, and Asian/Pacific Islander.
Prostate Cancer U.S. Death Rates* by Race and Ethnicity, U.S., 1975–2005
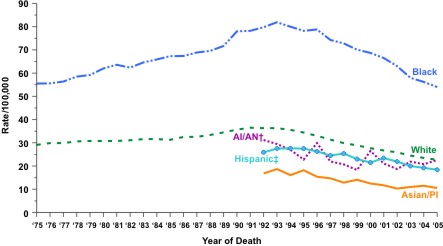
Mortality source: U.S. Mortality Files, National Center for Health Statistics, CDC.
*Rates are per 100,000 and are age-adjusted to the 2000 U.S. standard population (19 age groups - Census P25-1130).
†Rates for American Indians/Alaska Natives are based on the CHSDA (Contract Health Service Delivery Area) counties.
‡Hispanics are not mutually exclusive from whites, blacks, Asians/Pacific Islanders, and American Indians/Alaska Natives. Mortality data for Hispanics do not include cases from Connecticut, Maine, Maryland, Minnesota, New Hampshire, New York, North Dakota, Oklahoma, and Vermont.
Contact Us:
- Centers for Disease Control and Prevention
Division of Cancer Prevention and Control
4770 Buford Hwy NE
MS K-64
Atlanta, GA 30341 - 800-CDC-INFO
(800-232-4636)
TTY: (888) 232-6348
24 Hours/Every Day - cdcinfo@cdc.gov
