2006 Progress Report: Cellulosic Carbon Fiber Precursors from Ionic Liquid Solutions
EPA Grant Number: R831658Title: Cellulosic Carbon Fiber Precursors from Ionic Liquid Solutions
Investigators: Collier, John R. , Petrovan, Simioan , Rials, Timothy G.
Institution: University of Tennessee - Knoxville
EPA Project Officer: Bauer, Diana
Project Period: June 1, 2004 through May 31, 2007 (Extended to May 31, 2008)
Project Period Covered by this Report: June 1, 2006 through May 31, 2007
Project Amount: $350,000
RFA: Technology for a Sustainable Environment (2003)
Research Category: Pollution Prevention/Sustainable Development
Description:
Objective:In this report, part of the data on the following three objectives is presented:
- Preparation of ionic liquid (IL) cellulose solutions from a dissolving pulp with the addition of lignin and/or xylose.
- Elongational rheology.
- Spinning of cellulosic fibers at different spinning parameters.
Experimental Part
Materials and Equipment. The IL ([C4min]Cl) was purchased from Fluka Chemie. The dissolving pulp of degree of polymerization (DP 670) was provided by Buckeye Technologies Inc., Memphis, TN. The organosolv lignin was purchased from Aldrich. The xylose and propyl gallate were purchased from Acros Organics.
Shear rheological measurements were done on an ARES (Advanced Rheometric Expansion System, TA Instruments) rheometer, using parallel plate geometry. Dynamic frequency sweep mode of operation was used to measure and plot complex viscosity and dynamic moduli (storage (G’) and loss (G”) modulus, respectively) versus angular velocity at different temperatures. The linear viscoelastic region was tested by performing a dynamic strain sweep test.
Elongational rheology measurements were done by using the hyperbolic dies technique developed by this group, which allows for the measurement of elongational viscosity of polymer melts and solutions at practical elongational strain rates of up to 1000 s-1. Capillary cylindrical dies on an Advanced Capillary Extrusion Rheometer (ACER) (ThemoFisher Scientific, Wandham, MA) rheometer were replaced with hyperbolic dies of different Hencky strain.
Solutions of different concentrations of cellulose were prepared by using an internal mixer type C. W. Brabender Type-6 mixer (C. W. Brabender Instruments, Inc.).
Technique. Dissolving pulp sheets were cut in small pieces, shredded to a fine powder, and then dried at 105°C to constant weight. IL solid powder was melted in the mixer chamber and then dissolving pulp and propyl gallate were added. The mixer was run at 60 RPM until a clear yellow solution was obtained. All solutions were stored in glass jars until used for rheological measurements.
Dynamic rheological measurements were performed on the ARES instrument using the parallel plate geometry (d = 20 mm at a gap of 1 mm). In order to avoid water uptake by the sample while running the experiment, the edge of the specimen between the plates was covered with a thin layer of viscosity standard silicon oil (29.1 Pa s at 25°C).
Results
Effect of Lignin and Xylose on Rheological Properties. The effect of adding lignin and/or xylose on the complex viscosity is seen from Figures 1–3, and the viscosity curves of the organosolv lignin is presented in Figure 4. Adding 1 to 2% lignin or xylose brings about an increase in complex viscosity at all tested temperatures. At a lower temperature, the addition of 1% lignin results in a bigger increase in viscosity. Adding 2% of lignin or xylose determines a smaller increase in viscosity, as compared with 1% additives of lignin or xylose.
![Figure 1. Complex Viscosity of Cellulose/IL Solutions With Lignin and/or Xylose at 80[C]](https://webarchive.library.unt.edu/eot2008/20081107224301im_/http://es.epa.gov/ncer/progress/images/R831658_06_001.gif)
Figure 1. Complex Viscosity of Cellulose/IL Solutions With Lignin and/or Xylose at 80°C
![Figure 2. Complex Viscosity of Cellulose/IL Solutions With Lignin and/or Xylose at 90[C]](https://webarchive.library.unt.edu/eot2008/20081107224301im_/http://es.epa.gov/ncer/progress/images/R831658_06_002.gif)
Figure 2. Complex Viscosity of Cellulose/IL Solutions With Lignin and/or Xylose at 90°C
![Figure 3. Complex Viscosity of Cellulose/IL Solutions With Lignin and/or Xylose at 100[C]](https://webarchive.library.unt.edu/eot2008/20081107224301im_/http://es.epa.gov/ncer/progress/images/R831658_06_003.gif)
Figure 3. Complex Viscosity of Cellulose/IL Solutions With Lignin and/or Xylose at 100°C

Figure 4. Complex Viscosity of Organosolv Lignin
The addition of lignin and/or xylose in the IL/cellulose solutions affects the viscoelastic characteristics of these solutions too, as seen from Figures 5–8. Replacing 1 to 2% cellulose with lignin makes the solution behave more like a viscous fluid, as seen from Figures 5 and 6, where a shifting of the cross-over point to higher values of angular velocities is recorded. A similar effect results if 1–2% cellulose is replaced by the same amount of xylose, as shown in Figures 7–8. Both effects can be explained by the fact that cellulose is a linear polymer, whereas lignin is a lower molecular weight cross-linked polymer and xylose is a low molecular weight sugar.
![Figure 5. Dynamic Moduli for a Solution of 9% Cellulose and 1% Lignin at 90[C]](https://webarchive.library.unt.edu/eot2008/20081107224301im_/http://es.epa.gov/ncer/progress/images/R831658_06_005.gif)
Figure 5. Dynamic Moduli for a Solution of 9% Cellulose and 1% Lignin at 90°C
![Figure 6. Dynamic Moduli for a Solution of 8% Cellulose and 2% Lignin at 90[C]](https://webarchive.library.unt.edu/eot2008/20081107224301im_/http://es.epa.gov/ncer/progress/images/R831658_06_006.gif)
Figure 6. Dynamic Moduli for a Solution of 8% Cellulose and 2% Lignin at 90°C
![Figure 7. Dynamic Moduli for a Solution of 9% Cellulose and 1% Xylose at 90[C]](https://webarchive.library.unt.edu/eot2008/20081107224301im_/http://es.epa.gov/ncer/progress/images/R831658_06_007.gif)
Figure 7. Dynamic Moduli for a Solution of 9% Cellulose and 1% Xylose at 90°C
![Figure 8. Dynamic Moduli for a Solution of 8% Cellulose and 2% Xylose at 90[C]](https://webarchive.library.unt.edu/eot2008/20081107224301im_/http://es.epa.gov/ncer/progress/images/R831658_06_008.gif)
Figure 8. Dynamic Moduli for a Solution of 8% Cellulose and 2% Xylose at 90°C
Cross-over point coordinates for all solutions at different levels of additive additions and different temperatures are given in Table 1. At lower temperatures, IL/cellulose solutions with small amounts of additives behave more like a viscoelastic fluid on a broader range of angular velocities. This viscoelastic domain is reduced as the percentage of the additive is increased. Also, at a higher cellulose fraction in the solution, a larger viscoelastic domain is recorded, as shown by the 14% cellulose solution.
Table 1. Change in Cross-Over Points with Respect to Temperature
Concentration |
Cross-over point |
Temperature |
||||
Total Additives |
Cellulose |
Xylose |
Lignin |
ω |
G'(=G") |
|
10 |
8 |
0 |
2 |
19.21 |
2328.4 |
80 |
10 |
8 |
0 |
2 |
48.60 |
2544 |
90 |
10 |
8 |
0 |
2 |
NA |
NA |
100 |
10 |
8 |
2 |
0 |
19.58 |
2137.6 |
80 |
10 |
8 |
2 |
0 |
53.14 |
2294.4 |
90 |
10 |
8 |
2 |
0 |
NA |
NA |
100 |
10 |
8 |
1 |
1 |
19.34 |
1914.9 |
80 |
10 |
8 |
1 |
1 |
39.90 |
2077.2 |
90 |
10 |
8 |
1 |
1 |
NA |
NA |
100 |
10 |
9 |
0 |
1 |
10.50 |
2056 |
80 |
10 |
9 |
0 |
1 |
28.24 |
2350 |
90 |
10 |
9 |
0 |
1 |
74.15 |
2392 |
100 |
10 |
9 |
1 |
0 |
14.47 |
2070 |
80 |
10 |
9 |
1 |
0 |
30.36 |
2216 |
90 |
10 |
9 |
1 |
0 |
70.63 |
2462 |
100 |
10 |
10 |
0 |
0 |
66.38 |
2786 |
80 |
10 |
10 |
0 |
0 |
NA |
NA |
90 |
10 |
10 |
0 |
0 |
NA |
NA |
100 |
15 |
14 |
0 |
1 |
1.299 |
3011 |
80 |
15 |
14 |
0 |
1 |
3.693 |
3300 |
90 |
15 |
14 |
0 |
1 |
9.645 |
3310 |
100 |
15 |
14 |
1 |
0 |
0.3907 |
1294. |
80 |
15 |
14 |
1 |
0 |
NA |
NA |
90 |
15 |
14 |
1 |
0 |
0.1073 |
374.0 |
100 |
|
Shifting of the complex viscosity curves with respect to temperature was also done for most of the solutions. In Figure 9, the master curve for the complex viscosity of a solution containing 9% cellulose and 1% lignin is displayed, showing a very accurate shifting procedure. |
||||||

Figure 9. Master Curve for IL/Cellulose Solution Containing 9% Cellulose and 1% Xylose
Elongational Rheology. Elongational viscosity curves for all concentrations and at three temperatures and Hencky 7 are presented in Figures 10 to 12. Similar curves were obtained at Hencky 6 and 8.4. Using the same shift factors determined from complex viscosity measurements, the shifting of elongational viscosity curves with respect to temperature was performed, and the master curve is given in Figure 13, showing a very accurate shifting with a value of 0.999 for the coefficient of determination. The activation energy for elongational flow, which is higher than that for most of the polyolefin’s we have tested in our laboratory, was also calculated from the Arrhenius plot, shown in the inset of Figure 13.

Figure 10. Elongational Viscosity of DP 670 8% Solution at Hencky 7

Figure 11. Elongational Viscosity of DP 670 10% Solution at Hencky 7

Figure 12. Elongational Viscosity of DP 670 12% Solution at Hencky 7

Figure 13. Elongational Viscosity Master Curve for 8% Solution
Hencky Strain Shifting of Elongational Viscosity. The dependence of the elongational viscosity on the Hencky strain is a result of the orientation developing in the polymeric fluid as it is being attenuated by flowing along the hyperbolic die channel. Two methods have been developed to calculate the Hencky strain shift factors, and thus the reduced elongational viscosity and reduced elongational strain rate. Method 1 is based upon an orientation ratio being equal to the relaxation times ratio. The shift factor, reduced elongational viscosity, and reduced elongational strain rate are defined by:
 (1)
(1)
 (2)
(2)
 (3)
(3)
where (aH)1 is a Hencky strain shift factor defined by Method 1, TR is the Trouton ratio, ηe/ηs, ηe and ηs are the elongational viscosity and shear viscosity, respectively, eH is Hencky strain, and  is the elongational strain rate. The subscript “0” indicates the value of the variable at the reference state, e.g., the Hencky strain, to which the data are being shifted, and the reference shear rate and reference elongational strain rate (for example, 1 s-1). Method 2 is based upon an “orientational viscosity ratio.” The shift factor, reduced elongational viscosity, and reduced elongational strain rate are defined by:
 (4)
(4)
 (5)
(5)
 (6)
(6)
Simultaneous Temperature and Hencky Strain Shifting of Elongational Viscosity. According to the temperature shifting and Hencky strain shifting shown above, the elongational viscosity curves taken at different temperatures can be generated into a single master curve. The elongational viscosity curves taken at different Hencky strains can be generated into a single master curve as well. Therefore, by combining these two shifting operations—shifting with respect to temperature, and shifting with respect to Hencky strain—and using the appropriate shift factors, a generalized master curve could be obtained and the elongational strain rate range of the experimental geometry extended. The reduced variables are defined by:
 (7)
(7)
and:
 , (8)
, (8)
for Method 1, and:
 (9)
(9)
and:
 (10)
(10)
for Method 2, respectively.
As seen from Figure 14, very accurate master curves were generated at all temperatures by shifting with respect to Hencky strain by using Method 2, which in general, gave better shifting in most cases. In Figure 15, the general master curve is presented by simultaneously shifting with both temperature and Hencky strain. This master curve was generated by shifting eight elongational viscosity curves on the reference curve at 90°C and Hencky 7. Similar master curves were generated for solutions of 8% and 12% cellulose.
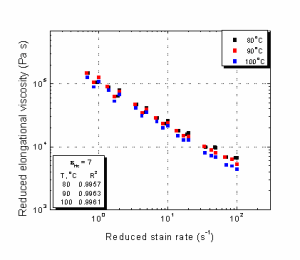
Figure 14. Hencky Strain Master Curves for 10% IL Solution at Different Temperatures

Figure 15. General Master Curve (Shifting With Both Temperature and Hencky Strain) for 10% IL Solution
Spinning of Cellulosic Fibers. Spinning was done using the ACER capillary rheometer as shown Figure 16. The IL/cellulose solution was preheated in order to load into the ACER barrel. This was done to minimize the air bubbles into the solution during the transfer from the jar to the barrel. The barrel was heated to the desired temperature of the run and the Hencky 7 die with the additional diameter plate and the screens that attached to the barrel. Due to the high viscosity of the solution, when loading, it would remain near the top of the barrel. However, over time the solution would travel down the length of the barrel and thermally equilibrate with the set barrel temperature.

Figure 16. Schematic of Wet Spinning Line Using ACER Rheometer
Once the IL/cellulose solution reached thermal equilibrium, the ram was attached and moved to a position in the barrel where it was in contact with the solution. The elongational strain rates were then set from lowest to highest, based on the experimental parameters. The solution was then extruded into the coagulation bath, and then drawn under two submerged stationary spools before being spun onto the collection spool. The spinner was set to the desired experimental parameters and varied throughout the spinning session. The collection spool was then soaked in water for approximately 2 days before being rinsed and dried.
The first step in the using the Scanning Electron Microscope (SEM) for the image analysis is the sample preparation. First, a small portion of fibers were cut and placed on to the stage. The stage was then placed into the SPI-Module Sputter Coater for a gold coating. The gold coating was applied in order to prevent the buildup of a surface charge when inside the microscope, thus enabling a clearer picture. This process was done for all the runs.
Once prepared, the samples were placed, six at a time, into the SEM. The samples were set at a distance of 6 millimeters from the electron source, which was set at 3 kilovolts. This enabled a better resolution at the lower magnification. A higher voltage would increase the magnification allowing for a clearer picture, but over time this would compromise the sample by creating an electron charge. The goal of the SEM images was to verify the surface morphology of the fibers and to determine the fiber diameter using the measuring analysis software, Scion Image.
The crystallinity measurements were determined using Wide Angle X-Ray Scatter (WAXS) equipment as well as the curve fit software called ProFit. Each sample was attached to the aluminum stage and the x, y, and z coordinates were measured for correct scanning to occur. The WAXS was run at 45 kV and 40 mA. The beginning angle was 5°, and the stopping angle was 35°. This range was determined from the first run, which indicated that the intensity peaks only occurred within this range.
After each scan was completed, the generated intensity peak graph was imported into the curve fit software, ProFit. This software determines the area under the first and second main intensity peaks as well as the amorphous region. The areas were then used to determine the crystallinity of the sample. The peak fitting was done at least three times to obtain three crystallinity measurements for each sample.
The intensity peaks shown in Figures 17 and 18 demonstrate the positive effect of increasing the concentration of cellulose in the IL solution and the draw ratio on the crystallinity of the spun fibers. Higher concentrations and draw ratios favor orientation of the macromolecular chains along the axis of the fiber, and this in turn leads to the increase in crystallinity.

Figure 17. X-ray Intensity Peak for Run #19

Figure 18. X-ray Intensity Peak for Run #25
More results on the spinning and cellulosic fiber characterization will be in the next phase report.
Conclusions
In this report, part of the data on preparation of IL/cellulose solutions from a dissolving pulp with the addition of lignin and/or xylose, elongational rheology, and spinning of cellulosic fibers are presented.
Replacing 1–2% of cellulose with lignin and/or xylose imparts a more viscous character to the IL solutions, due to the lower molecular weight of the lignin and xylose sugar. The viscoelastic character of these solutions was studied by dynamic measurements of dynamic moduli.
Elongational viscosity measurements demonstrated that IL/cellulose solutions behave similar with lyocell solutions, as shown by the pattern of elongational viscosity curves at different temperatures and Hencky strains. Shifting of the elongational viscosity curves with respect to temperature, Hencky strain, and with both was done and activation energy calculations performed from the slope of the Arrhenius plots. Again, activation energy for elongational flow is similar with that for lyocell solutions and higher than that corresponding to many polyolefin’s.
Spinning of cellulosic fibers was performed by using a wet spinning line driven by the ACER rheometer to which a hyperbolic die was attached to enhance orientation before drawing the fibers throughout the coagulation bath. The effect of different spinning parameters on the fiber crystallinity and their physico-mechanical characteristics is studied.
Journal Articles:No journal articles submitted with this report: View all 1 publications for this project
Supplemental Keywords:, INTERNATIONAL COOPERATION, TREATMENT/CONTROL, Sustainable Industry/Business, Scientific Discipline, RFA, Technology for Sustainable Environment, Sustainable Environment, Chemical Engineering, Technology, Environmental Engineering, Environmental Chemistry, Chemistry and Materials Science, pollution prevention, carbon fibers, cleaner production, clean technologies, automotive industry, catalysts, cellulose, automotive components, ionic liquids, elongational flow spinning process, clean manufacturing
Progress and Final Reports:
2004 Progress Report
2005 Progress Report
Original Abstract