Intimate
Partner Violence in the U.S.
Victim Characteristics
Gender |
Age |
Marital status |
Race |
Hispanic origin |
Income |
Home ownership |
Children exposed to intimate partner violence
Gender
Females are more likely than males to experience nonfatal intimate partner violence.
On average between 2001 and 2005, nonfatal intimate partner victimizations represented —
- 22% of nonfatal violent victimizations against females age 12 or older
- 4% of nonfatal violent victimizations against males age 12 or older.
Victim/offender relationship in nonfatal violent victimizations, by victim and gender, 2001-2005
| |
Average annual rate per 1,000 persons age 12 or older |
|
|
|
|
Female |
Male |
|
|
| Victim/offender relationship |
|
Rate |
Percent |
Rate |
Percent |
|
| |
|
|
100 |
% |
|
100 |
% |
| Intimate |
|
4.2 |
21.5 |
|
0.9 |
3.6 |
|
| Other relative |
|
1.7 |
8.9 |
|
1.2 |
4.6 |
|
| Friend/acquaintance |
|
7.0 |
36.2 |
|
8.6 |
34.3 |
|
| Stranger |
|
6.5 |
33.4 |
|
14.4 |
57.4 |
|
For homicides, intimate partners committed —
- 30% of homicides of females.
- 5% of homicides of males.
Homicide victim/offender relationship by victim gender, 1976-2005
| |
|
|
Percent of homicide victims
by
gender |
| |
|
| Victim/offender relationship |
Female |
Male |
|
| |
Total |
|
100 |
% |
100 |
% |
| Intimate |
|
30.1 |
|
5.3 |
|
| Other family |
|
11.7 |
|
6.7 |
|
| Acquaintance/Known |
|
21.8 |
|
35.5 |
|
| Stranger |
|
8.8 |
|
15.5 |
|
| Undetermined |
|
27.7 |
|
37.1 |
|
Trends for nonfatal intimate partner victimization differ by gender.
The rate of nonfatal intimate partner victimization for —
- females was about 4 victimizations per 1,000 persons age 12 or older
in 2005, down from about 10 in 1993.
- males remained stable between 2004 and 2005.
To view data, click on the chart.  [D] [D]
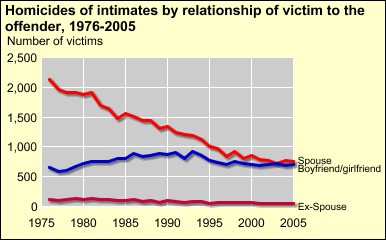
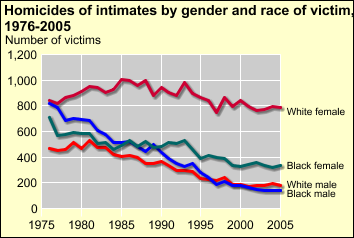
Homicides of intimates have declined, especially among male victims.
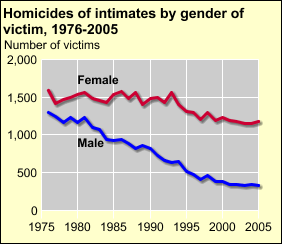 [D]
[D] See
Intimate homicide in Homicide Trends in the United States.
 To the
top
To the
top
Age
For females of most age categories, nonfatal intimate partner victimization
declined over time.
- In general, females ages 12 to 15 and age 50 or older were at the lowest risk of nonfatal intimate partner violence.
- During 2005, females ages 35 to 49 were at a
greater risk of nonfatal intimate partner violence than older females.
To view data, click on the chart.  [D] [D]
With the exception of males and females age 65 or older, average annual rates from 2001 through 2005 for nonfatal intimate partner victimization were higher for females than males within each age category.
- Females ages 20 to 24 were at the greatest risk of nonfatal intimate partner
violence.
- In general, males ages 12 to 15 and age 65 or older experienced the lowest rates
of nonfatal intimate partner violence.
To view data, click on the chart.  [D] [D]
Marital Status
Rates of nonfatal intimate
partner violence for females who were married, divorced, separated, or never married were lower in 2005 than in 1993.
Females who were —
- separated reported higher rates than females of other marital status
- married reported the lowest rates of nonfatal intimate partner
violence.
To view data, click on the chart.
 [D]
[D] On average from 2001 to 2005, both females and males who were separated
or divorced had the greatest risk of nonfatal intimate partner violence while
persons who were married or widowed reported the lowest risk of violence.
To view data, click on the chart.  [D] [D] Most intimate homicides involved spouses, although in recent years the number of deaths by boyfriends and girlfriends was about the same.
 [D] [D]
See Intimate homicide
in Homicide Trends in the U.S.
To the
top
Race
Between 1993 and 2005, rates of nonfatal intimate partner violence decreased
for white females, white males, and black females.
Between 2004 and 2005, rates of intimate partner violence remained stable for —
- white females at 3.1 per 1,000 persons age 12 or older
- black females at 4.6 per 1,000 persons age 12 or older
- white males at .7 per 1,000 persons age 12 or older
To view data, click on the chart.  [D] [D]
Intimate homicide rate has fallen for blacks in every relationship category, while the rate for whites has not changed for all categories.
 [D] [D]
See Intimate homicide
in Homicide Trends in the U.S.
The average annual rate of nonfatal intimate partner violence from 2001 to 2005 was —
- generally higher for American Indian and Alaskan Native females.
- similar for black females and white females.
 [D] [D]
Note: In 2003 racial categories were changed. Caution is warranted when examining these categories over time. See National Crime Victimization Survey Methodology in Additional Information about the data for more details. Information about nonfatal intimate partner victimization of persons of other races is provided as average annual estimates because the small number of cases in each category was not sufficient for reliable annual estimates. Information is not provided for Asian males because the small number of cases is insufficient for reliable analysis.
To the
top
Hispanic origin
Between 1993 and 2005, the rate of nonfatal intimate partner victimizations
declined for —
- Hispanic females by two-thirds.
- Non-Hispanic females by over half.
 [D] [D]
On average from 2001 to 2005, rates of intimate partner violence were similar for both Hispanic and non-Hispanic females and males.
 [D] [D]
To the
top
Income
From 2001 to 2005, for nonfatal intimate partner victimization —
- females living in households with lower annual incomes experienced the highest
average annual rates.
- females remained at greater risk than males within each income level.
To view data, click on the chart.
 [D] [D]
To the
top
Home ownership
From 2001 to 2005, for nonfatal intimate partner violence —
- average annual rates were higher for persons living in rental housing than other types of housing regardless
of the victim's gender.
- females residing in rental housing were victimized at an average annual rate more than 3 times the rate of females living in owned housing.
- males residing in rental housing were victimized by an intimate partner about 3 times the rate of males
living in owned housing.
Average annual rate of nonfatal intimate partner victimization by home ownership, 1993-2005
|
|
Female |
Male |
|
|
|
| Home ownership |
|
|
|
| |
Owned |
2.3 |
0.6 |
|
| |
Rented |
9.0 |
1.7 |
|
To the
top
Children exposed to intimate partner violence
On average between 2001 and 2005, children were residents of the households experiencing intimate partner violence
in —
- 38% of the incidents involving female victims.
- 21% of the incidents involving male victims.
Average annual number and percentage of households experiencing nonfatal intimate partner violence where children under age 12 resided, by gender of victims, 2001-2005
| |
Annual average |
| Households with intimate
partner violence victims |
|
| Number |
Percent |
|
| All households with - |
615,795 |
100 |
% |
|
Children |
216,490 |
35.2 |
|
|
No children |
303,615 |
49.3 |
|
|
Unknown |
95,685 |
15.5 |
|
|
| |
|
|
|
| Female victim households with - |
510,970 |
100 |
% |
|
Children |
194,455 |
38.1 |
|
|
No children |
235,940 |
46.2 |
|
|
Unknown |
80,580 |
15.8 |
|
|
| |
|
|
|
| Male victim households with - |
104,820 |
100 |
% |
|
Children |
22,040 |
21.0 |
|
|
No children |
67,680 |
64.6 |
|
|
Unknown |
15,105 |
14.4 |
|
The NCVS does not ask about the extent to which young children may have witnessed the
violence.
|