|
|
Drought
Information for West Central Texas
Current Drought
Conditions
|

|
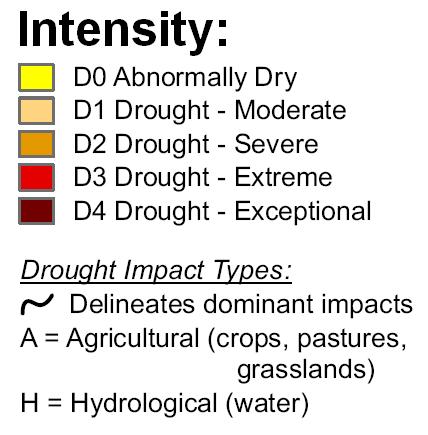
For a detailed explanation of the map, click on the image below.
|
The U.S.
Drought Monitor is a weekly collaborative effort among the following partners:
National Oceanic and
Atmospheric Administration (NOAA),
U.S. Department of Agriculture
(USDA) and
National Drought Mitigation
Center (NDMC)
Local Drought
Conditions

The map above is produced by
NDMC and shows the current drought conditions across Texas.
Click on the map to go to the U.S. Drought Monitor web page for Texas.
West Central Texas - Drought Information Statement
Latest Statement: Text Version
Additional Links
National Integrated Drought Information System
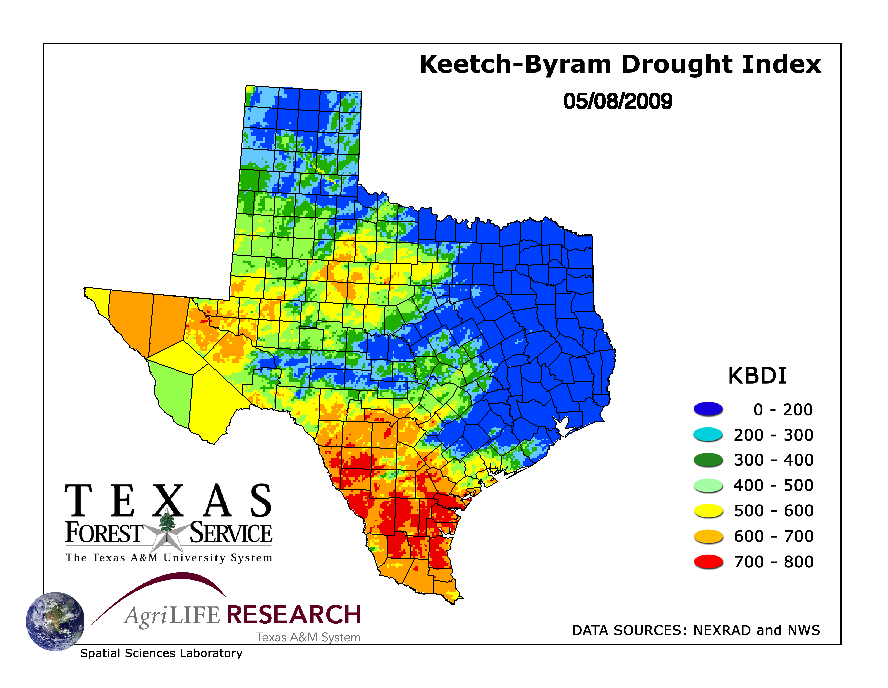
Keetch-Byram Drought Index
Drought Impact Reporter
NOAA Drought Information Center
TxWin Drought Monitoring
Palmer Drought Index
Precipitation Analysis
The National Weather Service Precipitation Analysis
page graphically shows the short-term observed and climatic trends of precipitation across the lower 48 United States (CONUS) and Puerto Rico. Click on the image
above to access the map. Various time spans are available from 24 hours to a year. Durations beyond 1 day also have Normal, Departure from Normal, and
Percent of Normal available for viewing. Once the page is loaded, click on the map to zoom into states or select a Weather Forecast Office (WFO) from a list.
Additional Precipitation Data
New - NWS Hourly Precipitation Analysis
Standardized Precipitation Index
Rainfall Frequency Atlas Maps
Climate and Outlook Information
The National Weather Service climate services consist of real-time monitoring, forecasting
products and services, models and technology (model output), observations, and public education and outreach.
|
Local Climate Data
The local Climate Page
includes daily climate reports, daily weather statistics, weather related records, daily temperature and precipitation summaries, etc. Click on
the image below to go to the climate page.
The Additional Local Climate Page
provides local weather extremes and records, holiday weather, COOP data, area climate summaries and much more. Click on
the image below to go to the additional climate information page.

Climate Summary Maps
The High Plains Regional Climate
Center (HPRCC) produce the daily Current Climate Summary Maps using data from the
Applied Climate Information System (ACIS). Stations used are from the National Weather Service Cooperative Observer Network (COOP), and the Automated
Weather Data Network (AWDN). Click on the image below to go to the HPRCC Current Climate Summary Maps.

|
Outlook Information
The Climate Prediction and Variability Page
contains maps of the 8-14 day forecasts for temperature and precipitation, a map of the latest U.S. Hazards Assessment, along with numerous additional links related to climate
prediction and variability.
Climate Prediction Center
One-Month Temperature and Precipitation Outlook


Three-Month Temperature and Precipitation Outlook


U.S. Seasonal Drought Outlook

El Niño/La Niña Information

|
Fire Weather Information
The Texas Forest Service (TFS)
displays the Texas Outdoor Burn Bans and Local Disaster Declarations Map as a public service. The county burn bans are established by County Judges and
or County Commissioner's Courts. Click on the image below to see the current outdoor burn ban map.

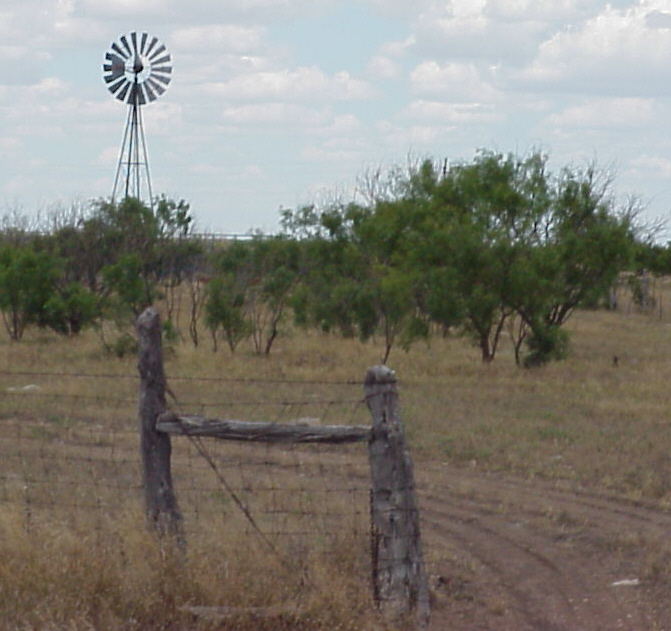
Agricultural Information
The Climate Prediction Center's U.S. Soil Moisture
Monitoring web site provides most recent day, monthly and 12 months calculated soil moisture, anomalies and percentiles. Click on the image below to
go to the series of soil moisture maps.
The Climate Prediction Center also provides
Topsoil Moisture Monitoring Maps and a
Crop Moisture Index Map.
The United States Department of
Agriculture (USDA) provides assistance for losses that result from drought. USDA's Farm Service
Agency (FSA) administers and manages farm commodity, credit, conservation, disaster and loan programs as laid out by Congress through a network of federal,
state and county offices.
The National Drought Mitigation
Center (NDMC) produces a Vegetation Drought Response Index (VegDRI) every two
weeks during the growing seasons. The VegDRI calculations integrate satellite-based
observations of vegetation conditions, climate data, and other biophysical information such as land cover/land use type, soil characteristics, and ecological setting.
The NDMC also produces a new experimental
tool call the Vegetation Outlook (VegOut) that provides future outlooks of general
vegetation conditions. VegOut integrates climate information and satellite-based observations
of current vegetation conditions with oceanic index data and other biophysical information about the environment (i.e., land cover type, irrigation status, soils, and
ecological setting) to produce 1-km2 resolution maps of projected general vegetation conditions into the future.
The AgriLIFE Research & Extension Center at San Angelo
provides resources to west central Texas farmers and ranchers to make agriculture more productive. Click on the image below to go to their web site.

The United States Department of
Agriculture (USDA) provides assistance for losses that result from drought. USDA's Farm Service
Agency (FSA) administers and manages farm commodity, credit, conservation, disaster and loan programs as laid out by Congress through a network of federal,
state and county offices.
Click here for the
Texas FSA Home Page.
Hydrologic Information
The United States Geological
Survey (USGS) provides a Water Watch map of Texas to show current water
resources conditions. Click on the image below to go to the USGS Texas Water Watch web page.

Local Contact Information
If you have any questions or comments about this drought information web page, please contact:
National Weather Service
7654 Knickerbocker Road
San Angelo, Texas 76904
Phone: 325-944-9445
Email:nws.sanangelo@noaa.gov
|

 National Weather Service Forecast Office


