Testimony
Statement by
Leslie V. Norwalk,
Acting Administrator
on
The Medicare Advantage Program
before
Committee on Ways and Means
Subcommittee on Health
U.S. House of Representatives
Wednesday, March 21, 2007
Chairman Stark, Ranking Member Camp and members of the Subcommittee, I am pleased to be here today to discuss the Medicare Advantage (MA) program. The MA program is providing an affordable, high value choice for all Medicare beneficiaries. Enrollment is at an all-time high and plans are available in every state across the country, including rural areas.
Trends in Medicare Advantage Plan Access and Enrollment
Medicare has a long history of offering alternatives to the traditional Medicare fee-for-service (FFS) program. In the 1970's, Congress authorized Medicare risk contracting with managed care plans, and in the 1980's further modified the program to make it more attractive to managed care companies and the Medicare beneficiaries they serve. Under that program, health maintenance organizations (HMOs) contracted with Medicare to provide the full range of Medicare benefits in return for monthly "per person" or "capitated" payment rates. In the Balanced Budget Act of 1997 (BBA), Congress created the Medicare+Choice program to correct perceived flaws in the risk contracting program, including significant payment differences across geographic areas. Since then, Congress has continued to refine the program, including changing its name to “Medicare Advantage” under the Medicare Prescription Drug, Improvement and Modernization Act of 2003 (MMA).[1]
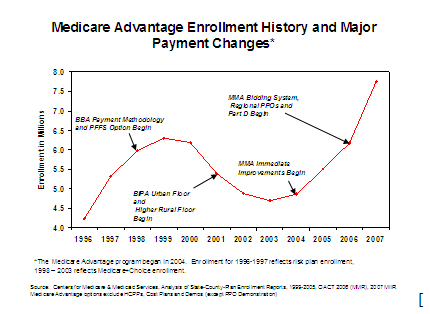
The chart below illustrates how legislation has affected the availability of and enrollment in MA plans.
 [
[
Before 1998 and up until the MMA, MA options were concentrated largely in urban areas. In 1997, private plan payment rates were based on FFS utilization patterns and geographic differences, resulting in payment rates in urban areas that were higher (and sometimes significantly higher) than those in rural areas. This difference contributed to Medicare beneficiaries in urban and suburban areas often having access to MA plans, while those in smaller urban and rural areas either had no options or options with less robust benefit packages. The fact that these options and benefitswere largely unavailable to ruralbeneficiaries led to interest by Congress in makingchanges to encourage more planparticipation in rural areas, and to enhance benefits available in some smaller urban areas that had lower payment rates and lower plan participation.
The BBA expanded the types of contracting options available under MA plans. It also dramatically increased payment rates in rural areas by creating a national payment floor. However, while it increased many rural payment rates, it also significantly restrained payment in areas that historically had relatively high private plan penetration. Following the BBA’s enactment, enrollment in private Medicare plans peaked at 6.3 million in 1999, before beginning a decline that continued for four years as the BBA’s payment restraints took their toll.
The Benefits Improvement and Protection Act of 2000 (BIPA)attempted to stop the decline in the program by increasing the national floor and creating a second, higher urban floor. The BIPA also added 1 percentage point to the minimum update for the period from March 2001 through the end of the calendar year. Even with this action, plan offerings remained compromised and enrollment continued to decline (though at a somewhat slower rate), reaching a low of 4.7 millionin 2003. Not until the MMA’s immediate payment improvements took effect in 2004 did plan participation and enrollment rates begin to improve.
Current Medicare Advantage Enrollment
With the MMA’s changes and immediate payment improvements effective in 2004, plan participation and beneficiary enrollment in MA again began to grow. Medicare implemented the Part D prescription drug benefit as well as a new regional preferred provider organization (PPO) option in 2006, and the payment methodology for MA plans changed to a bid-based payment system in 2006.
Today, in 2007, beneficiaries in all fifty states have access to MA plan options. Almost one in five beneficiaries (8.3 million) elected private plan coverage for 2007. Of these enrollees, 93 percent are in MA plans, with the remainder in other private Medicare plan options such as cost contract plans or PACE plans. Medicare Advantage includes HMOs, local and regional PPOs, and Private Fee-for-Service (PFFS) plans. PFFS plans are important for rural enrollees. Thirty-one percent of beneficiaries in PFFS plans come from rural areas.
One new type of coordinated care plan is called a Special Needs Plan (SNP). SNPs were first available in 2004, when some demonstrations were converted to SNP contracts, and in 2006 new market entrants become available. These plans are able to target their services at particularly vulnerable populations, including those with chronic conditions, the institutionalized or dual eligibles. Medical Savings Accounts (MSAs) are also MA plans, but because they are an option that is newly offered to beneficiaries they have not enrolled a significant number of beneficiaries to date.
MA enrollment by plan type from 2006 to 2007
Plan type | 2006 (August) | 2007(February) | Increase in enrollees | Percent change |
Local CCP | 6,126,100 | 6,275,341 | 149,241 | 2% |
PFFS | 802,068 | 1,327,826 | 525,758 | 66% |
RPPOs | 89,492 | 120,770 | 31,278 | 35% |
Total | 7,017,660 | 7,723,937 | 706,277 | 10% |
Note: These numbers include employer sponsored group health plans. Special Needs Plans are included in the Local Coordinated Care Plans (CCP) totals. Cost and Program of All-Inclusive Care for the Elderly (PACE) plans are excluded.
Enrollment in rural areas has grown significantly. From 2003 to 2007 605,115
beneficiaries in rural areas joined the MA program, a 426 percent change. The chart
below illustrates the types of choices Medicare Advantage enrollees are making. Thirty one
percent of PFFS enrollees are from rural areas.
Urban/Rural Enrollment by Plan type, 2007
| | Urban | Rural |
| | % of Total | % of Total |
Eligibles | 78.0% | 22.0% |
MA Enrollment | | |
local CCP | 92.9% | 7.1% |
Regional CCP | 79.7% | 20.3% |
PFFS | 68.8% | 31.2% |
Total | 88.4% | 11.6% |
Medicare Advantage Payment Overview
Under the revised payment methodology included in the MMA, MA plans submit bids for costs of delivering Part A and Part B services. These bids are compared to plan-specific benchmarks to determine the total payment to plans.
- Plan Bids - The plan bid is each plan’s estimate of the cost of delivering Part A and Part B services. It is risk-adjusted based on the health status and other characteristics of plan enrollees. To the extent the plan provides care coordination services, these costs are included as part of their bid for Part A and B services. The plan bid is each plan’s estimate of the cost of delivering Part A and Part B services to the average Medicare beneficiary. It is risk-adjusted based on the characteristics of individual plan enrollees. Pursuant to the Deficit Reduction Act and a CMS announcement in 2005, budget neutral risk adjustment, which increases plan payments, is being phased out. The phase-out began in 2007, with 55 percent of the budget neutrality factor included in plan payments. The phase out will be completed in 2011. To the extent the plan provides care coordination services, these costs or savings are included as part of their bid.
- Plan Benchmarks - Benchmarks are the maximum amount Medicare will pay a plan for delivering Part A and B benefits in a specific geographic area; they are determined by the Secretary each year under a methodology provided in the Medicare law. For most plans, benchmarks are based on the county capitation rates used for payment purposes before the bidding system began in 2006. Plan benchmarks are averages of county rates weighted based on projected plan enrollment in each county in the plan service area. (Regional plan benchmarks are based primarily on county capitation rates, but plan bids are also factored in). The vast majority of plan bids are below their respective benchmarks. If a plan bid is above the benchmark, the enrollee must pay the difference in the form of a premium, referred to as the “basic beneficiary premium.”
- Beneficiary Rebates - If a plan’s bid is less than its benchmark, 75 percent of the difference, termed the rebate, must be provided to enrollees as extra benefits in the form of cost-sharing reductions, premium reductions for Part B or Part D, or additional covered services. For local plans, the remaining 25 percent of the difference is retained by the Federal Treasury. For regional PPOs, 12.5 percent of the difference is retained by the Federal Treasury and the remaining 12.5 percent is directed to the MA Regional Plan Stabilization Fund.
Simplified Example
| | Plan A (vast majority) | Plan B (few) |
Benchmark amount | $700 | $700 |
Plan bid | $600 | $750 |
Difference | $100 | ($50) |
Plan receives from Medicare | $600 (risk adjusted) + (.75*$100) = $675.* | $700 (risk adjusted) |
Basic beneficiary premium | None | $50 |
*The additional 75 percent must be rebated to beneficiaries, either as extra benefits or Part B or D premium rebates.
Some have suggested in recent years that Medicare is overpaying MA plans. The March 2007 MedPAC report concludes that in 2006, payments to MA plans were on average 12 percent higher than estimated costs if MA enrollees were still in FFS Medicare. Both the MedPAC analysis and a recent Commonwealth Fund study define this “payment differential” as the amount by which payments for Medicare beneficiaries in the MA program exceed estimated payments that would have been made if the MA enrollees had remained in FFS Medicare. There are important factors to keep in mind in considering the payment differential presented by these analyses:
Payment for Added Benefits– In fact, payments to MA plans are not just for the costs of delivering Part A and B services (i.e. plan bid); payments also include the cost of providing the additional benefits that plans bidding below the benchmark are required by statute to offer. Any additional benefits must be a part of the overall bid, available through beneficiary rebates as required by the statute.
Original Medicare Payments Are Reduced by excluding IME Payments – Before MedPAC or the Commonwealth Fund compared payments made to MA plans to estimate Medicare FFS amounts, each group reduced the FFS amounts to carve out payments for certain teaching hospital expenses (i.e. indirect medical education (IME)) while leaving similar IME payments in the MA side of the equation. In both the MedPAC and Commonwealth analyses, IME costs were removed from estimated FFS costs to reflect the current double payment for IME (one going to hospitals, and one included in plan payments) on the part of Medicare. The President’s FY 2008 budget has proposed to eliminate this double payment to hospitals.
Budget Neutrality - Pursuant to the Deficit Reduction Act and a CMS announcement in 2005, budget neutral risk adjustment, which increases plan payments, is being phased out. The phase-out began in 2007, with 55 percent of the budget neutrality factor included in plan payments. The phase out will be completed in 2011. The comparison of 2006 FFS and MA payments does not show the effect of phasing out the budget neutrality adjustment. To the extent the plan provides care coordination services, these costs/savings are included as part of their bid.
In large part, any remaining differential reflects Congressional decisions to increase the benchmark above FFS in certain areas, such as rural areas, to ensure access to private plans across the country.
The Value of Medicare Advantage
Competition in the MA program creates significant value for beneficiaries. For example, care coordination generally is not available under the traditional Medicare FFS program, but is routinely offered by MA plans. Due to the current payment structure of the MA program, MA plans provide important benefits beyond the FFS package relied on by Medicare beneficiaries. For example, MA enrollees typically benefit from reduced cost-sharing relative to FFS Medicare; all regional PPO enrollees have the protection of a required catastrophic spending cap and a combined Part A and B deductible. In addition:
- 64 percent of plans have coverage for eye glasses;
- 77 percent have coverage for routine eye exams;
- 87 percent cover additional acute care stay days; and
- 90 percent cover SNF stays beyond the FFS benefit.
In 2007, enrollees in MA plans are receiving, on average, additional benefits with a value of $86 per month. Medicare Advantage plans restructure and reduce cost-sharing relative to traditional Medicare. $67 in average monthly savings is included in the $86 MA value. Examples using 2007 data include:

Example 1: In Medicare FFS a beneficiary would pay $992 inpatient hospital deductible and daily coinsurance of $248 for days 61 to 90 of a hospital stay. A Medicare Advantage enrollee in Albuquerque, New Mexico only pays $200 per stay.

Example 2: In Medicare FFS. A beneficiary would pay a $131 deductible and 20% coinsurance for physician services. A Medicare Advantage enrollee in Lincoln, Nebraska has no deductible and pays $10 per plan physician visit.
Finally, many MA plan enrollees also receive basic Part D prescription drug coverage at a lower cost than stand-alone Part D plans (PDPs) can provide. Enrollees in MA plans that include Part D coverage (MA-PDs) save money on drug coverage in two ways. First, MA plan drug premiums for basic coverage are on average about seven dollars less than average PDP premiums for basic coverage. Second, the MA payment structure allows MA-PDs to use rebates to further reduce Part D premiums. On average, Part D premium savings from rebates is more than $13 per month.
Medicare Advantage is an Important Option for Low-Income and Minority Beneficiaries
Low-income beneficiaries rely on the availability of MA plans and the extra benefits they provide. An analysis of the 2005 Medicare Current Beneficiary Survey (MCBS) shows that a disproportionate percentage of low-income beneficiaries enroll in MA plans. Fifty-seven percent of MA beneficiaries have annual income between $10,000 and $30,000 as compared to 46 percent of FFS beneficiaries. The table below illustrates the important choice the MA program provides to beneficiaries with incomes in this range.
Income Status Distribution of Beneficiaries by Type of Coverage
| | $10,000 – 20,000 | $20,000 – 30,000 |
Medicare Advantage | 35% | 22% |
FFS | 27% | 19% |
Minorities also rely heavily on the MA program. The 2005 MCBS data analysis also shows that a disproportionately higher percentage of minorities are in MA plans. As shown in the chart below, twenty-seven percent of MA beneficiaries are minorities, as compared to 20 percent of FFS beneficiaries, illustrating the importance of MA options for these Medicare beneficiaries.
Minority-status Distribution of Beneficiaries by Type of Coverage
| | Non-Hispanic White | Minorities* |
Medicare Advantage | 73 % | 27% |
FFS | 80% | 20% |
*Includes non-Hispanic African-American, Hispanic, and other (including Asian, Native American, and Pacific Islanders)
The Future of Medicare Advantage
Beneficiaries with chronic conditions are a large and growing portion of the Medicare population for whom optimal care is critical. According to the Congressional Budget Office (CBO), in 2001 over 75 percent of high cost beneficiaries had one or more of seven major chronic conditions. In a 2003 report released in the New England Journal of Medicine, researchers found that patients with chronic conditions received necessary care just 56 percent of the time. More Americans with these chronic conditions are becoming eligible for the Medicare program, and at the same time are living longer. Avoiding the costs associated with preventable acute episodes is one of the central challenges for the Medicare program in the future.
MA plans have led the way in developing care managementprograms for chronic diseases andintegrating them into their overallapproach to care. This isbecause they have the incentives(capitated payments) and the clinical and administrative structures such as provider networks and complete medical records that allow the application of data-driven clinical protocols that drive disease management and appropriate utilization of expensive services. In addition, MA plans are required on an ongoing basis to collect and apply quality performance data to quality improvement and chronic care management projects that also drive improvement in overall clinical management. Quality performance information on MA plans is also made public, and can be used in choosing health plans.
Capitated payments in the MA program provide incentives to manage utilization and in particular to work with beneficiaries to prevent unnecessary admissions, including readmissions, and complications that would arise from poorly controlled diseases. According to the MedPAC SGR Report on Alternatives to the SGR, “Capitated payments also provide incentives for plans without networks of providers to work directly with providers and beneficiaries, as many disease management companies do, to ensure enrollees receive appropriate follow-up and preventive services.”
Care coordination services are not required in the FFS program; to create them would require enactment of legislation. FFS providers are not currently expected or required to coordinate care across settings or over time with patients after they leave their specific setting of care and in fact, the existing payment system and Medicare’s current rules actively discourage coordination of care. Integral to the long-term sustainability of the Medicare program is better managing the care of those with chronic illness. The ongoing support and expansion of a stable MA program may provide an effective strategy for caring for the unique needs of the growing Medicare population.

Conclusion
Mr. Chairman, thank you again for this opportunity to testify on the MA program. We look forward to working with Congress to further strengthen this system that promotes access, excellent benefits, and high quality care.
I would be happy to answer any of your questions.
[1] For consistency, we will use the term “Medicare Advantage” or MA throughout the testimony rather than Medicare+Choice or other superseded names.
Last revised: March 26,2009


 Print
Print  Download Reader
  HHS Home|About HHS|Contact Us
