|
May 2008
Sports and Exercise
What percentage of people (aged 15 years and older) who live in the United States participated in sports and exercise activities on an average day in recent years? About 16 percent. In comparison, consider that the number of people who watched television on an average day is roughly five times larger.
These charts, which display data from the American Time Use Survey, take a closer look at people who spend time in sports and exercise activities.
Exercise Statistics All Over the Map
People living in the Pacific, New England, and Mountain regions of the country are more likely to participate in sports or exercise activities than those in other regions. In fact, those living in the Pacific region are about 50 percent more likely to exercise on an average day than are those in the East South Central and West South Central regions.
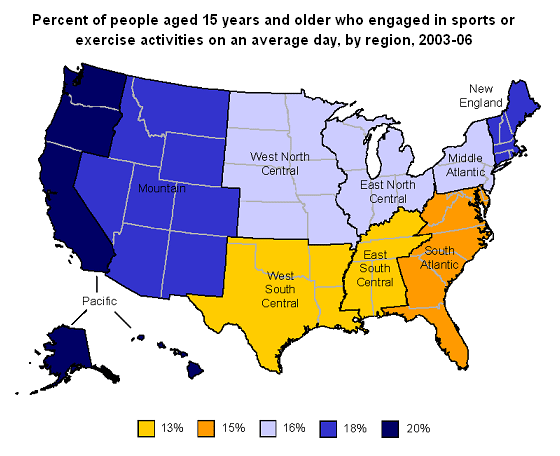
Source: American Time Use Survey | Chart Data
More School, More Play
People with higher levels of education were more likely to participate in sports and exercise. Among people aged 25 years and older, those with a bachelor's degree or higher were more than twice as likely to participate in sports and exercise activities on an average day during the 2003-06 period as those with a high school diploma or less.
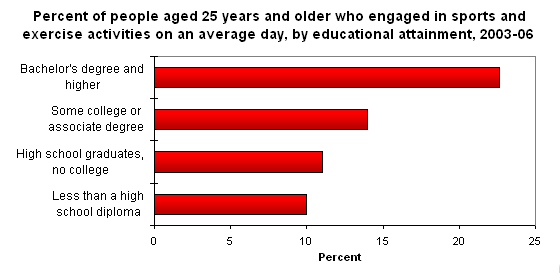
Source: American Time Use Survey | Chart Data
Walking is Most Popular Exercise Activity
In recent years, of the relatively small group of people in the United States aged 15 years and older who engaged in sports or exercise activities on an average day, about 30 percent walked for exercise, making walking the most popular form of exercise overall. Basketball was the team sport that people engaged in most frequently. On an average day, 5 percent of those who exercised played basketball.
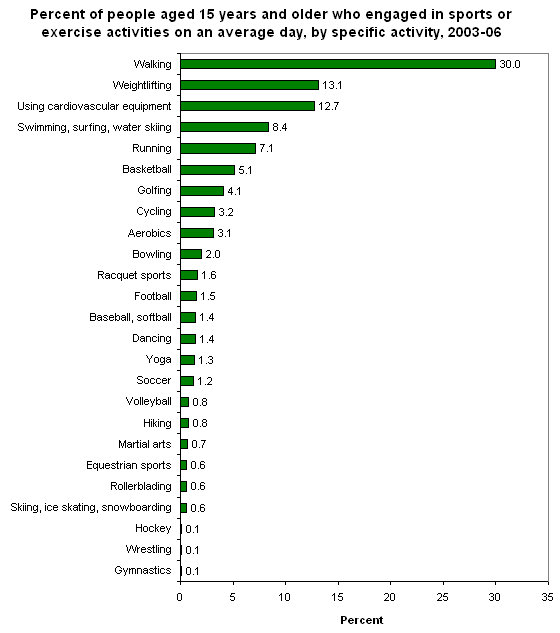
Source: American Time Use Survey | Chart Data
NOTE: Data in this chart and those that follow are based on the approximately 16 percent of persons who engaged in any sports or exercise activity on an average day.
Differing Sports and Exercise Activities for Men and Women
Men were slightly more likely than women to participate in sports and exercise activities on an average day, but their preferences for specific forms of exercise differed markedly. Football, basketball, golf, and soccer were dominated by male participants. About 96 percent of football players were male, for example. Yoga and aerobics primarily had female participants. Bowling and swimming, surfing, and water skiing were the most gender-neutral activities, with nearly equal shares of men and women participating in them.
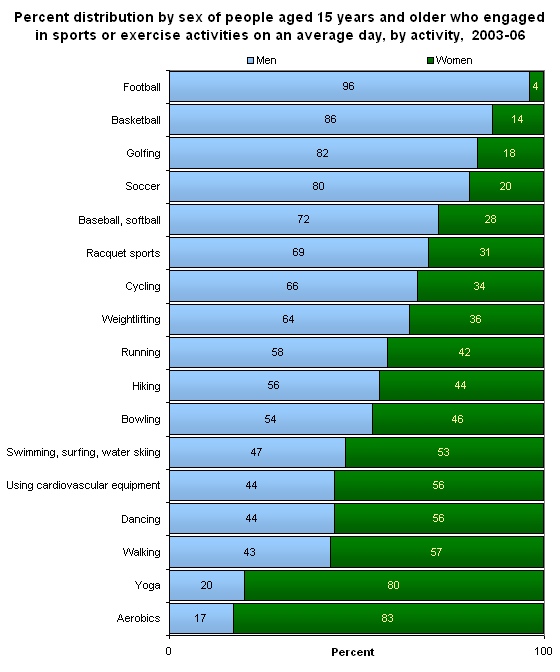
Source: American Time Use Survey | Chart Data
Sports and Exercise Activities among Various Age Groups
The specific sports and exercises people do vary by age. People aged 15 to 24 years were more likely to participate in team sports such as basketball, football, and soccer than those 25 and older. About one-half of those who walked for exercise — the sports and exercise activity that people most frequently engaged in overall — were aged 55 years and older. By contrast, racquet sports were the sports and exercise activities that had the most equal distribution of participants across age groups for those aged 15 to 24 years, aged 25 to 54, and aged 55 and older.
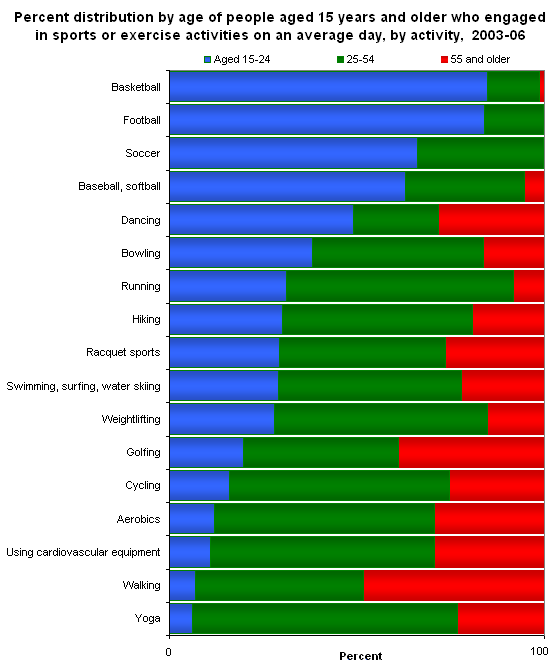
Source: American Time Use Survey | Chart Data
Companions During Sports and Exercise Activities
In the United States, people who exercise were about as likely to exercise alone as with a companion present. Of those aged 15 years and older who engaged in a sports and exercise activity on an average day in 2003-06, about one-half did the activity alone. Men and women were equally likely to exercise alone. But women were more likely to engage in sports and exercise activities with family and men were more likely to engage in these activities with friends.
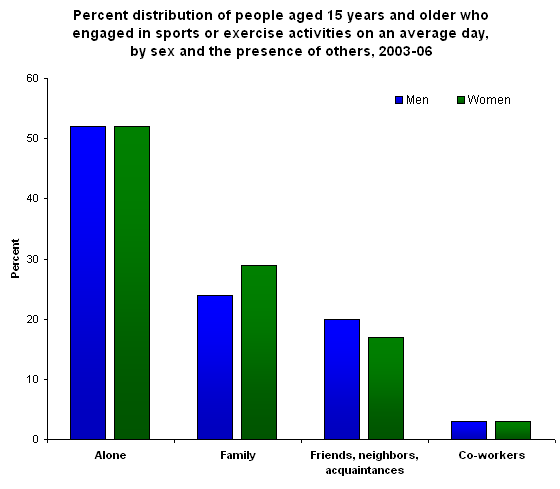
Source: American Time Use Survey | Chart Data
Time Spent Exercising
Almost 75 percent of people aged 15 years and older who engaged in a sports and exercise activity on an average day in 2003-06 did so for less than two hours. The most common exercise duration was between 30 and 59 minutes.
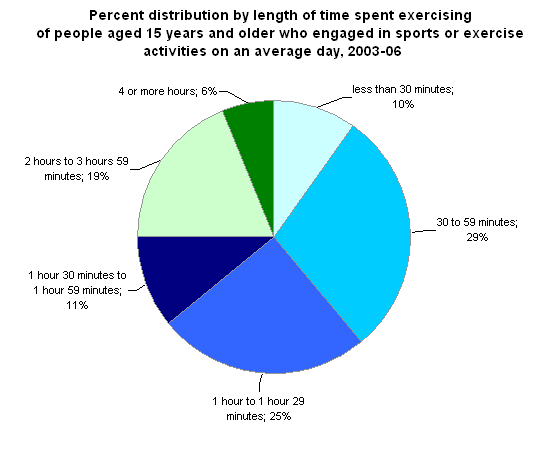
Source: American Time Use Survey | Chart Data
Hours Spent on Various Exercise Activities
The average length of time spent exercising for people aged 15 years and older who engaged in a sports and exercise activity was one and one-half hours. The amount of time varies considerably by the type of activity. Those who used cardiovascular exercise equipment, did aerobics, ran, lifted weights, walked, or did yoga spent the least time exercising. Those who danced, played baseball or softball, bowled, played football, hiked or golfed spent the most time doing sports activities.
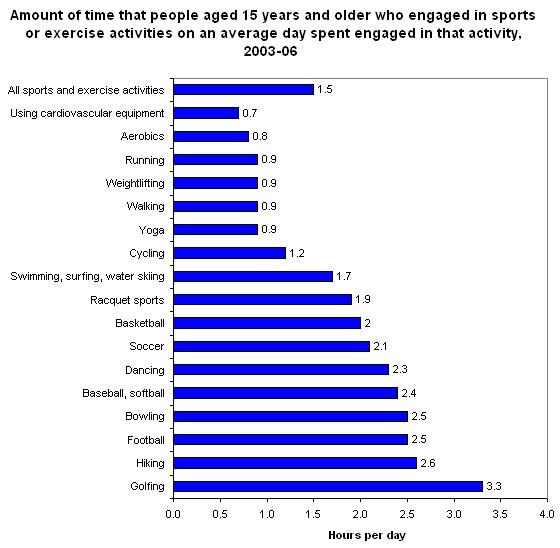
Source: American Time Use Survey | Chart Data
Making Time to Exercise
Sports and exercise time is often scheduled around other activities, such as work. Employed people aged 25 to 54 years who engaged in sports and exercise activities on an average day in 2003-06 were most likely to participate in these activities during the late afternoon and evening hours on days they worked, and during the morning and early afternoon hours on non-workdays.
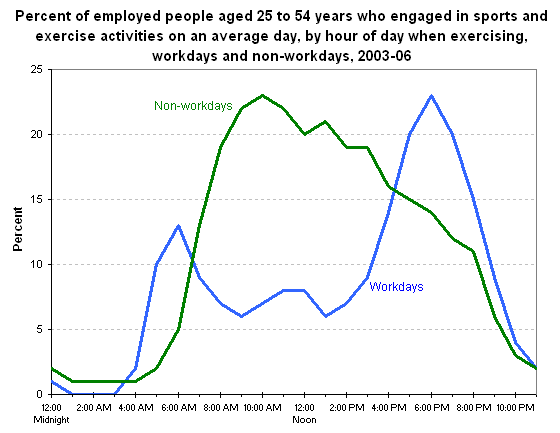
Source: American Time Use Survey | Chart Data
NOTE: The percentages associated with each time refer to the hour that starts at that time. For example, the percentages associated with 1:00 AM cover the interval from 1:00 AM to 1:59 AM.
Note: Data in text, charts and tables are the latest available at the time of publication. Internet links may lead to more recent data.
General Information: (202) 691-5200
Media Contact: (202) 691-5902
|