Skip all navigation and jump to content Jump to site navigation Jump to section navigation.
NASA Logo - Goddard Space Flight Center + Visit NASA.gov
HOME PROJECTS RESOURCES SEARCH MAP

+ Advanced Search
Home
Home
View Most Recently Released Imagery
View Gallery of Imagery: A topical collection of SVS Imagery
Search Imagery by the keywords assigned to it
Search Imagery by the instruments that supplied data for a visualization product
Search Imagery by the series of visualizations that have been produced
Search Imagery by the scientist providing the data used in a visualization product
Search Imagery by the animator that created the product
Search Imagery by the identification number assigned to the visualization product
See other search options
Learn about the SVS Image Server
  + About the Server
  + Animation List
  + How to Use the Server


  + RSS Feeds
  + Podcasts


  + Opportunities
blank image
Previous Animation
Next Animation
September 2007 Arctic Sea Ice vs 1979-2007 Average with Graph of 1979 to 2008 Ice Areas

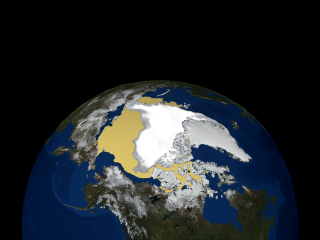
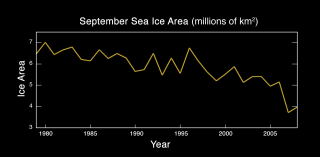
Sea ice is frozen seawater floating on the surface of the ocean. Some sea ice is semi-permanent, persisting from year to year, and some is seasonal, melting and refreezing from season to season. The sea ice cover reaches its minimum extent at the end of each summer and the remaining ice is called the perennial ice cover. The 2007 Arctic summer sea ice reached the lowest extent of perennial ice cover on record. The area of the perennial ice has been steadily decreasing since the satellite record began in 1979, at a rate of about 10% per decade. But the 2007 minimum, reached on September 14, is about 38% lower than the climatological average. Such a dramatic loss has implications for ecology, climate and industry.

This image compares the difference between the perennial sea ice minimum area on September 14, 2007 and the 1979-2007 average minimum sea ice. A graph inset in the top left corner shows the decline in annual sea ice area from 1979 through 2008.


The sea ice image with labels and the graph inset    The sea ice image with labels and the graph inset

Available formats:
  3840 x 2880     TIFF 6 MB
  1280 x 960       TIFF   962 KB
  320 x 240         PNG     192 KB
  160 x 80           PNG       42 KB
  80 x 40             PNG       17 KB


The sea ice image without labels and the graph inset    The sea ice image without labels and the graph inset

Available formats:
  3840 x 2880     TIFF 6 MB
  1280 x 960       TIFF   937 KB
  320 x 240         PNG     185 KB


The graph inset    The graph inset

Available formats:
  1620 x 795       TIFF   115 KB
  320 x 157         PNG       29 KB

Animation Number:3573
Completed:2009-01-09
Animators:Cindy Starr (GST) (Lead)
 Greg Shirah (NASA/GSFC)
Scientist:Josefino Comiso (NASA/GSFC)
Platforms/Sensors/Data Sets:DMSP/SSM/I
 Nimbus-7/SMMR
 Comiso's September Minimum Sea Ice Concentration
Data Collected:2007-09-14, 1979-2007 Average
Keywords:
DLESE >> Cryology
GCMD >> EARTH SCIENCE >> Cryosphere
GCMD >> EARTH SCIENCE >> Cryosphere >> Sea Ice
GCMD >> EARTH SCIENCE >> Cryosphere >> Snow/Ice
GCMD >> EARTH SCIENCE >> Oceans >> Sea Ice
GCMD >> EARTH SCIENCE >> Cryosphere >> Sea Ice >> Ice Extent
GCMD >> EARTH SCIENCE >> Cryosphere >> Sea Ice >> Ice Types
GCMD >> EARTH SCIENCE >> Cryosphere >> Sea Ice >> Sea Ice Concentration
GCMD >> EARTH SCIENCE >> Cryosphere >> Snow/Ice >> Ice Extent
GCMD >> EARTH SCIENCE >> Hydrosphere >> Snow/Ice >> Ice Extent
GCMD >> EARTH SCIENCE >> Oceans >> Sea Ice >> Ice Extent
 
 
Please give credit for this item to
NASA/Goddard Space Flight Center Scientific Visualization Studio


Back to Top

USA.gov logo - the U.S. Government's official Web portal. + Privacy Policy and Important Notices
+ Reproduction Guidelines
NASA NASA Official:
SVS Contact:
Curator: