|
|
 |
Recent Glacier Mass Changes in the Gulf of Alaska Region from GRACE Mascon Solutions
|
Mass changes of the Earth's ice sheets and glacier systems are of considerable importance because of their sensitivity to climate change and their contribution to rising sea level. Recent changes in the cryosphere highlight the importance of methods for directly observing the complex spatial and temporal variation of land ice mass flux. Since its launch in March of 2002, the NASA/DLR Gravity Recovery and Climate Experiment (GRACE) mission has been acquiring ultra-precise inter-satellite K-band range and range-rate (KBRR) measurements enabling a direct mapping of static and time-variable gravity. These data provide new opportunities to observe and understand ice mass changes at unprecedented temporal and spatial resolutions. In order to improve upon the ice mass change observations derived from GRACE, we have employed unique data analysis approaches to obtain lumped harmonic local mass concentration solutions (mascon solutions) from GRACE inter-satellite range-rate measurements. We have computed multi-year time series of surface mass flux for Greenland and Antarctica coastal and interior ice sheet sub-drainage systems as well as the Alaskan glacier systems. These mascon solutions provide important observations of the seasonal and inter-annual evolution of the Earth's land ice. Additionally, these solutions facilitate a detailed comparison to surface elevation change observations from spaceborne and airborne laser altimetry as well as surface melt observations. We present our latest mascon solutions of the Alaska mountain glaciers. We compare these mass flux solutions to ICESat and airborne laser altimeter observations of surface elevation change as well as surface melt observations derived from MODIS data. The combination of GRACE high-resolution mass flux observations together with the surface elevation change and surface melt observations is beginning to reveal a detailed understanding of the Earth's high latitude land ice evolution.
|
|
|
|
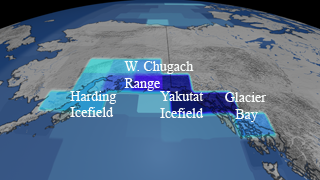
The mass changes of the Gulf of Alaska glaciers are computed from the Gravity Recovery and Climate Experiment (GRACE) inter-satellite rate data from April 2003 through September 2007. Using space-borne gravity measurements to assess glacier mass balance NASA scientists determine mass variations along the Gulf of Alaska, an area apanning 18,919 square miles. Areas of deep blue like the areas around Glacier Bay and the Yakutat Icefield represent significant mass loss where inland areas of dark gray represent slight mass gains.
Available formats:
3840 x 2160
TIFF
8 MB
320 x 180
PNG
72 KB
160 x 80
PNG
70 KB
80 x 40
PNG
25 KB
|
|
|
|
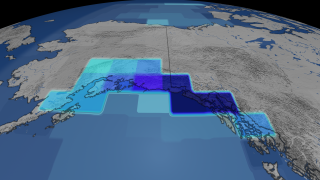
Same image as above without labels
Available formats:
3840 x 2160
TIFF
8 MB
320 x 180
PNG
251 KB
|
|

|
|
Glacier Mass Rate of Change color table
Available formats:
320 x 90
PNG
7 KB
|
|
|
Back to Top
|
|
|
|

