|
|
 |
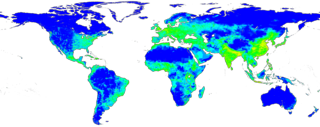
Population Density of the World, 1990-2015 (WMS)
|
This animation shows the population density of the world in the years 1990, 1995, 2000, as well as a population density estimated for the year 2015. These figures have been adjusted to match United Nations totals. The most dramatic differences in population are not readily visible in this animation because they are located in cities. The maximum population density in 1990 was about 79,000 people per square kilometer, while the estimated maximum population density in 2015 will be about 236,000 people per square kilometer. Developing areas in Africa, Latin America, and Asia change the most visibly.
|
|
|
|
This animation shows the population density for 1990, 1995, and 2000, and the estimated population density in 2015.
Duration: 4.0 seconds
Available formats:
2048x814
Frames
720x480 (29.97 fps)
MPEG-2
2 MB
320x127
PNG
93 KB
80x40
PNG
7 KB
4096x1627
Frames
160x80
PNG
23 KB
640x480 (30 fps)
MPEG-1
745 KB
320x240 (30 fps)
MPEG-1
761 KB
320x240 (30 fps)
X-FLV
386 KB
How to play our movies
|
|
This product is available through our Web Map Service.
Click here to learn more.
|
|

|
|
Legend for population density.
Available formats:
320 x 90
PNG
11 KB
|
|
|
Back to Top
|
|
|
|


