|
|
 |
How To... - Interpret Data - Case Studies - Low
Birthweight
Who: Which mothers are most likely to deliver infants of low birthweight?
Race/ethnicity, age, and education are person characteristics included
in PNSS. The PNSS Table 12C, Infant Health Indicators by Race/Ethnicity,
Age or Education, shows the prevalence of low birthweight infants by
racial/ethnic, age, or education group.
Sample: PNSS Table 12C, Infant Health Indicators by Race/Ethnicity,
Age or Education
 |
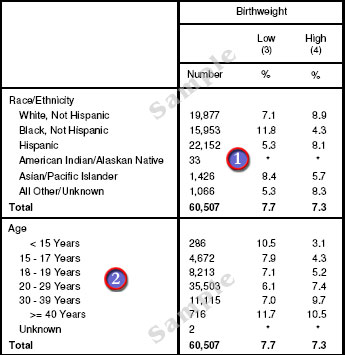
The prevalence of low birthweight infants is highest
among black women (11.8%) compared to the white (7.1%), Hispanic
(5.3%), and Asian/Pacific Islander (8.4%) women. The Total or overall
prevalence for all racial and ethnic groups in the state is 7.7%.
Note that the prevalence for low birthweight infants among black women
is much higher than the overall prevalence for the state (7.7%). |
 |
Teenagers, particularly young teens, and women 40
years of age and older are more likely to have infants who are low
birthweight. The prevalence of low birthweight for teenagers less than
15 years of age was 10.5% and 11.7% for women greater than or equal to
40 years of age compared to the overall prevalence of all women of 7.7%
for the state. |
The following graph, derived from Table 12C, shows the prevalence of low
birthweight for each racial/ethnic group in the state and the national
PedNSS as well as the Healthy People 2010 target of 5% for low
birthweight.
|
Prevalence of low birthweight*
by race and ethnicity
* Low Birthweight includes VLBW < 1500 g and LBW =
1500-<2500 g.
** Year 2010 target: Reduce low birthweight to < 5.0 percent. |
Additional information about Who is delivering low birthweight
infants can be found on Table 13C, Maternal Weight Gain and Birth Outcomes
by Selected Health Indicators. In this table low birthweight is examined
by mother’s prepregnancy BMI, her weight gain during pregnancy, and
smoking status. Each of these health indicators is thought to effect low
birthweight and this table allows for the analysis of those indicators.
- Mother’s weight prior to pregnancy has an effect on infant
birthweight. The Institute of Medicine (IOM) guidelines have based
weight gain recommendations on mother’s prepregnancy Body Mass Index
(BMI).
- Maternal weight gain, also called gestational weight gain, refers to
the amount of weight gained from conception to delivery of the infant.
“Ideal weight gain” is the recommended amount of weight a women should
gain based on her prepregnancy BMI for optimal infant birthweight and
infant health (IOM guidelines). Less than ideal weight gains are
considered to be a major determinant of low birthweight as well as
infant mortality and morbidity.
- Smoking accounts for 20 to 30 percent of all low birthweight births
in the United States. The effect of smoking on low birthweight appears
to be attributable to intrauterine growth retardation rather than to
preterm delivery.
|
|
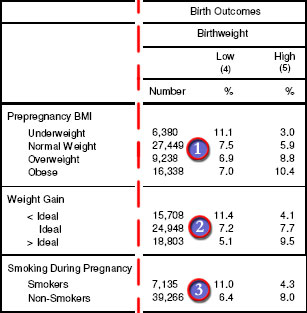
Women who are underweight prior to pregnancy have the highest prevalence
of low birthweight at 11.1% compared 7.5% for normal weight women. |
|
|
Women with < ideal weight gain have a 11.4 %
prevalence of low birthweight compared to the prevalence of 7.2% for
women who gained the recommended amount of weight or ideal weight gain. |
 |
The prevalence of low birthweight infants for mothers
who smoked during pregnancy was 11%, compared with 6.4% for mothers who
did not smoke. |
The following graph derived from Table 13C, shows the prevalence of low
birthweight for underweight women, women who gained less then the
recommended weight gain or < ideal, and who smoked during pregnancy
compared to the the Healthy People 2010 target of 5% for low
birthweight.
|
Prevalence of low birthweight*
by select health indicators
* Low birthweight includes VLBW < 1500 g and LBW =
1500-<2500 g.
** Year 2010 target: Reduce low birthweight to < 5.0 percent. |
Who: Which mothers are most likely to deliver infants of low birthweight?
The prevalence of low birthweight is highest among black women (11.8%),
teenagers less than 15 years of age (10.5%) and women 40 years of age and
older (11.7%) compared to the prevalence of 7.7% for all women in the
state.
The prevalence of low birthweight is also highest among women that are
underweight (11.1%), those that gain less than the recommended weight gain
(11.4%) and those who smoked during pregnancy (11%) compared to the
prevalence of normal weight women (7.5%), women who gained the recommended
amount of weight (7.2%), and women that smoked during pregnancy (6.4%).
back to top
|
|