| 1. |
The source for this table is ACF-801 data for
FY 2003. |
| 2. |
National percentages are based on the "adjusted"
national numbers unless otherwise indicated. In other words,
the national percentages are equivalent to a weighted average
of the State percentages, where the weights are the "adjusted"
number of families or children served as appropriate. |
| 3. |
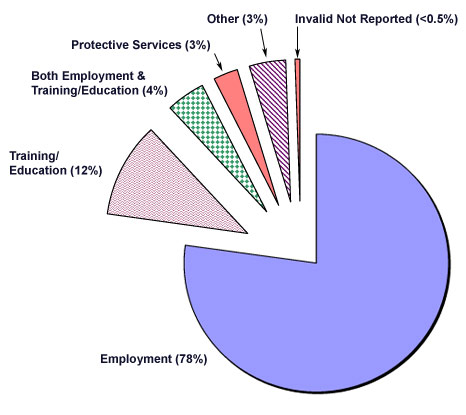
The Invalid/Not Reported only includes family
records with an invalid or missing number for ACF-801 element
6. |
| 4. |
Several States only capture the primary reason
for receiving services and therefore do not report any families
in the Both Employment and Training/Education category. |
| 5. |
Inconsistencies in income reporting appear in
several States between ACF-801 element 6 (reason for receiving
a subsidy, element 9 (total income for determining eligibility),
and elements 10 through 15 (the sources of income). Records
containing such inconsistencies are included in the measures
above. |
| 6. |
Puerto Rico and the Virgin Islands were unable to report ACF-801
case-level data before report preparation. |
| 7. |
Alaska's population reported does not accurately reflect the
population served due to sampling difficulties the State is
trying to resolve. |
| 8. |
In some instances, the Total may appear to be slightly more
or less than 100% because of rounding. |