System maintenance is being done today at 4pm MDT. This work may affect web and data availability.
Historical Sea Surface Temperatures and
Recent Hurricane Activity
| Discussion
Hurricanes Katrina and Rita were both associated with
anomalously warm sea surface temperatures in the Gulf of Mexico
(mostly Region 2*) during the month of August 2006, in particular.
Hurricane Wilma became a record-breaking third Category-5 hurricane
of the season in October, in the wake of exceptionally high Sea
Surface Temperature (SST) recorded in the Western Caribbean (Region
4; September 2006 plot).
Standardized Time Series
The time series plots below are based on the Hadley SST dataset
from 1871-1981, and the NOAA OI V2 after that. Data has been
standardized by the monthly climatology (1971-2000) and is area
averaged.
|
|
Hurricane Images |
Katrina

|
Rita

|
Wilma

|
|
| Standardized Anomalies |
Mean Temperatures |
| Region* |
Jul |
Aug |
Sep |
| Western Gulf of Mexico |
X |
X |
X |
| Eastern Gulf of Mexico |
X |
X |
X |
| Eastern Florida Coast |
X |
X |
X |
| Western Caribbean |
X |
X |
X |
| Eastern Caribbean |
X |
X |
X |
|
| Region* |
Jul |
Aug |
Sep |
| Western Gulf of Mexico |
X |
X |
X |
| Eastern Gulf of Mexico |
X |
X |
X |
| Eastern Florida Coast |
X |
X |
X |
| Western Caribbean |
X |
X |
X |
| Eastern Caribbean |
X |
X |
X |
|
|
* Region Definitions:
- Western Gulf of Mexico: 18-30N,
88W-98W
- Eastern Gulf of Mexico: 20-30N,
81W-88W
- Florida Shelf/Bahamas: 20-30N,
70W-81W
- Western Caribbean: 10-20N,
71W-88W
- Eastern Caribbean: 10-20N,
60W-71W
|
 |
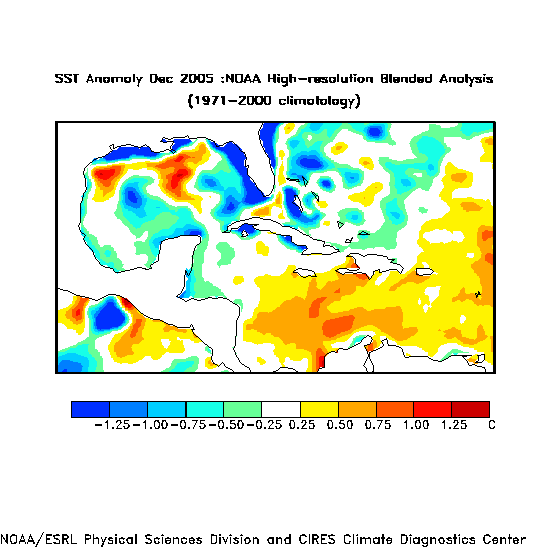
| Latest SST
Anomaly Maps
You can choose from the following maps. They are based on the
.25x.25 degree NOAA High Resolution Analysis. The climatology used is
1971-2000.
|
Useful Timeseries
How SST's affect hurricanes: From the NOAA Hurricane Research Division FAQ


