|
12 Months Percent Change
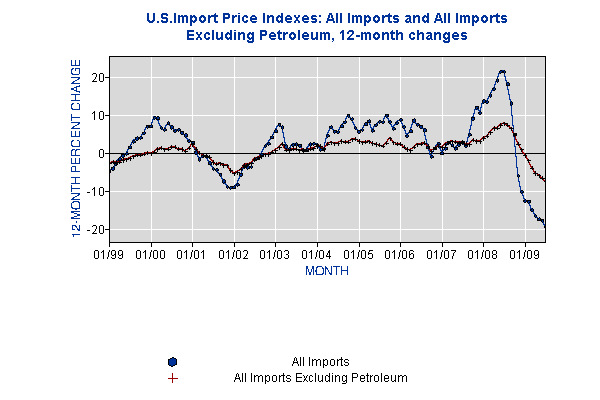
Series Id: EIUIR | |||||||||||||
| Year | Jan | Feb | Mar | Apr | May | Jun | Jul | Aug | Sep | Oct | Nov | Dec | Annual |
|---|---|---|---|---|---|---|---|---|---|---|---|---|---|
| 1999 | -4.8 | -4.0 | -2.8 | -1.6 | -0.6 | -0.2 | 1.6 | 3.0 | 3.9 | 4.0 | 5.3 | 7.0 | |
| 2000 | 7.1 | 9.3 | 9.2 | 6.6 | 6.1 | 7.9 | 6.8 | 5.9 | 6.1 | 5.4 | 4.7 | 3.2 | |
| 2001 | 2.8 | 0.2 | -1.6 | -0.7 | -0.8 | -2.6 | -4.1 | -4.4 | -5.6 | -7.4 | -8.8 | -9.1 | |
| 2002 | -8.9 | -8.3 | -5.6 | -3.6 | -3.7 | -3.6 | -1.7 | -1.3 | -0.4 | 1.9 | 2.5 | 4.2 | |
| 2003 | 5.8 | 7.5 | 6.8 | 1.8 | 1.0 | 2.2 | 2.3 | 2.0 | 0.7 | 0.8 | 2.3 | 2.4 | |
| 2004 | 2.2 | 0.9 | 1.1 | 4.6 | 6.9 | 5.7 | 5.6 | 7.1 | 8.2 | 9.9 | 9.0 | 6.7 | |
| 2005 | 5.7 | 6.1 | 7.6 | 8.4 | 5.9 | 7.4 | 8.2 | 8.2 | 9.9 | 8.2 | 6.4 | 8.0 | |
| 2006 | 8.7 | 6.9 | 4.5 | 5.8 | 8.6 | 7.4 | 7.0 | 6.0 | 1.6 | -1.0 | 1.3 | 2.5 | |
| 2007 | 0.0 | 1.2 | 2.8 | 2.1 | 1.2 | 2.3 | 2.8 | 1.9 | 4.8 | 9.1 | 12.0 | 10.6 | |
| 2008 | 13.6 | 13.5 | 15.2 | 16.9 | 19.1 | 21.3 | 21.4 | 18.1 | 13.1 | 4.9 | -5.9 | -10.1 | |
| 2009 | -12.5 | -12.7 | -14.9 | -16.4(R) | -17.3(R) | -17.7(R) | -19.3 | ||||||
| R : Revised | |||||||||||||
12 Months Percent Change
Series Id: EIUIREXPET | |||||||||||||
| Year | Jan | Feb | Mar | Apr | May | Jun | Jul | Aug | Sep | Oct | Nov | Dec | Annual |
|---|---|---|---|---|---|---|---|---|---|---|---|---|---|
| 1999 | -2.6 | -2.3 | -2.4 | -2.3 | -1.9 | -1.7 | -1.4 | -0.9 | -0.5 | -0.5 | -0.2 | 0.0 | |
| 2000 | -0.1 | 0.3 | 1.0 | 1.3 | 0.9 | 1.1 | 1.6 | 1.6 | 1.1 | 1.0 | 0.5 | 1.3 | |
| 2001 | 2.2 | 1.1 | 0.0 | -0.6 | -0.7 | -1.0 | -2.4 | -2.8 | -2.7 | -3.2 | -3.3 | -4.5 | |
| 2002 | -5.4 | -5.1 | -4.2 | -3.2 | -3.0 | -2.7 | -1.6 | -1.2 | -0.9 | -0.4 | -0.3 | 0.3 | |
| 2003 | 0.7 | 1.5 | 2.4 | 0.8 | 0.7 | 1.1 | 1.1 | 0.7 | 0.9 | 0.8 | 1.1 | 1.2 | |
| 2004 | 1.8 | 1.9 | 1.0 | 2.4 | 2.8 | 2.5 | 2.5 | 3.1 | 2.9 | 2.9 | 3.6 | 3.7 | |
| 2005 | 3.1 | 2.8 | 2.9 | 3.0 | 2.6 | 2.3 | 2.1 | 1.9 | 2.7 | 3.8 | 2.8 | 2.4 | |
| 2006 | 2.4 | 1.6 | 1.0 | 0.7 | 1.6 | 2.2 | 2.4 | 2.7 | 1.9 | 0.4 | 1.4 | 1.9 | |
| 2007 | 1.5 | 2.2 | 2.8 | 3.0 | 2.9 | 2.8 | 2.9 | 2.4 | 2.2 | 3.4 | 3.1 | 3.0 | |
| 2008 | 3.9 | 4.5 | 5.4 | 6.5 | 6.6 | 7.3 | 7.8 | 7.4 | 6.4 | 4.9 | 2.4 | 0.9 | |
| 2009 | -0.6 | -2.0 | -3.9 | -5.3 | -5.9 | -6.5 | -7.3 | ||||||
The Import Price Indexes are a measure of the average change in import prices of a fixed market basket of goods. The prices are generally either "free on board" (f.o.b.) foreign port or "cost, insurance, and freight" (c.i.f.) U.S. port transaction prices, depending on the practices of the individual industry. All indexes use a modified Laspeyres formula, are weighted with a 2000 trade weight, and are not seasonally adjusted.
In addition to the Import Price Indexes, the International Price Program (IPP) also produces Export Price Indexes, selected International Services Indexes, and Import Price Indexes by locality of origin. For historical IPP data, click the International Price Indexes icon below or call our information staff at 202-691-7101.