

2008 Environmental Performance Update
Environmental Policy
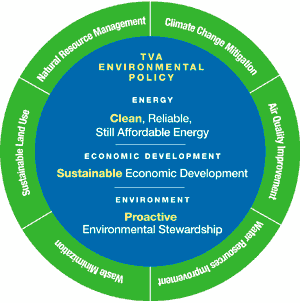 TVA’s
overarching Environmental Policy objective is to provide cleaner,
reliable, and affordable energy, support sustainable economic growth
in the Tennessee Valley, and engage in proactive environmental
stewardship in a balanced and ecologically sound manner.
TVA’s
overarching Environmental Policy objective is to provide cleaner,
reliable, and affordable energy, support sustainable economic growth
in the Tennessee Valley, and engage in proactive environmental
stewardship in a balanced and ecologically sound manner.
The Environmental Policy was established in May 2008. To reflect TVA’s alignment with the policy’s guiding principles, the 2008 Environmental Performance Update has a new look. Although a few measures used in previous years are no longer a part of the update, other indicators have been included to best demonstrate TVA’s environmental performance in each policy area.
Guiding Principles
TVA will continue to integrate responsible environmental practices into its operations by establishing goals, measuring progress, and reporting performance through a comprehensive environmental management system. Employees are trained in their environmental responsibilities and factor environmental considerations into business decisions. TVA remains committed to complying with environmental laws and regulations, with a goal of continuous improvement.
 Climate Change Mitigation
TVA plans to actively reduce its carbon emissions through energy options and energy efficiency initiatives.
Peak demand reduction
TVA promotes energy-use assessments, heat pump installations, and other measures in new and existing homes to help reduce the demand for electricity. Through its energy right® Program and Energy Services Company (ESCO), it provides energy management information and analysis to consumers and industries to assist them in their energy consumption planning (read an ESCO case study). Commercial and industrial customers can also participate in a demand reduction program in which they are paid monthly for agreeing to reduce their demand if requested. For fiscal year 2008, TVA set a goal of reducing peak demand by 35 megawatts (MW). The actual amount achieved was 47.5 MW.
Renewable generation
One of TVA’s goals is to generate a greater portion of its electricity using clean and renewable resources. In addition to existing and incremental hydro*, solar, wind, and methane gas generation, TVA is pursuing up to 2,000 MW of clean, renewable energy purchases. Additionally, the GPS Generation Partners program was expanded to provide greater incentives for residences and businesses to add green generation sources.

*Incremental hydro is defined as additional generation resulting from: (1) efficiency improvements to existing hydroelectric units, or (2) installation of new generating units in empty bays at existing hydroelectric dams. The decrease in total renewable generation in 2007 and 2008 was primarily due to a reduction in hydro generation, which was 26 percent lower than normal in 2008 due to drought conditions.
| Fiscal Year | Actual |
Goal |
2006 |
10,769 |
|
2007 |
9,725 |
|
2008 |
6,799 |
9,773 |
Clean energy generation
About 35 percent of TVA’s current generation comes from non-carbon-emitting sources: nuclear, hydropower, and renewables. TVA forecasts that it will reduce its carbon footprint and provide 50 percent of its generation from low-carbon or non-carbon-emitting sources by 2020.
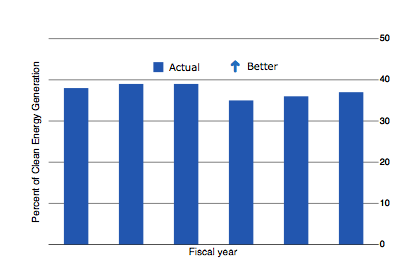
The decrease in 2006, 2007, and 2008 was primarily due to a reduction in hydro generation. In 2008 hydro generation was 26 percent lower than normal due to drought conditions. TVA forecasts that 50 percent of its clean energy generation will be from low-carbon or non-carbon-emitting sources by 2020.
| Fiscal Year | Actual |
2003 |
38 |
2004 |
39 |
2005 |
39 |
2006 |
35 |
2007 |
36 |
2008 |
37 |
CO2 emission rate
Carbon dioxide (CO2) emissions per gigawatt-hour (GWh) of total TVA generation is an indicator of TVA's greenhouse gas emissions and a measure of TVA's diverse generation mix (fossil, nuclear, hydro, solar, wind, and natural gas).
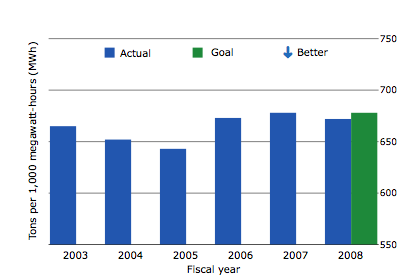
Scale does not start at zero, making data variation more apparent. Prior to 2004, figures were based on calendar year.
| Fiscal Year | Actual |
Goal |
2003 |
665 |
|
2004 |
652 |
|
2005 |
643 |
|
2006 |
673 |
|
2007 |
678 |
|
2008 |
672 |
678 |
Greenhouse gas and emissions-related TVA-wide technology implementation
In addition to internal research and testing, TVA’s Research & Development organization partners with other federal agencies, such as DOE’s National Energy Technology Laboratory, and consortiums like the Southeast Regional Carbon Sequestration Partnership to identify and evaluate technologies to reduce carbon dioxide and other greenhouse gas emissions. Other efforts to reduce emissions and improve air quality include a TVA-patented mercury catalyst that could help meet future mercury emission limits, and an EPRI-sponsored air aerosol study designed to identify sources of organic carbon.
Green Power Switch
Green Power Switch (GPS) is a program that allows Valley consumers to purchase electricity from renewable sources, including solar, wind, and methane gas. Although no source of energy is impact-free, renewable resources create less waste and pollution. This is a measure of megawatt-hours (MWh) of green power sold to commercial, industrial, and residential consumers.
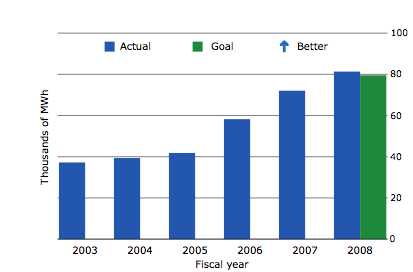
| Fiscal Year | Actual |
Goal |
2003 |
37.21 |
|
2004 |
39.35 |
|
2005 |
41.82 |
|
2006 |
58.24 |
|
2007 |
72.04 |
|
2008 |
81.33 |
79.52 |
TVA buildings' energy consumption
This indicator measures the amount of energy consumed in TVA's standard buildings, including office, shop, restroom, and warehouse facilities.
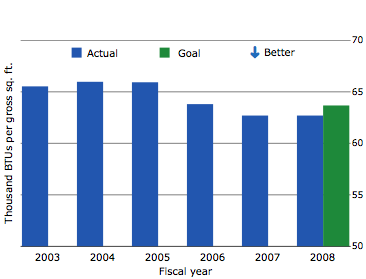
Scale does not start at zero, making data variation more apparent.
| Fiscal Year | Actual |
Goal |
2003 |
65.530 |
|
2004 |
65.974 |
|
2005 |
65.928 |
|
2006 |
63.807 |
|
2007 |
62.697 |
|
2008 |
62.697 |
63.676 |
 Air Quality Improvement
TVA improves regional air quality by installing emission control equipment on existing generation and planning for cleaner future energy options.
Air quality expenditures
The Tennessee Valley enjoys cleaner air today than it has in many decades, thanks in part to TVA’s continued commitment to reduce its emissions and their impact on the environment. TVA has spent $5.1 billion to date on clean air modifications at its coal-fired power plants. In 2008, ozone-season nitrogen oxide (NOx) emissions were 82 percent below peak 1995 levels, and sulfur dioxide (SO2) emissions were 85 percent below peak 1977 levels, despite the fact that total generation had increased 54 percent since 1975.
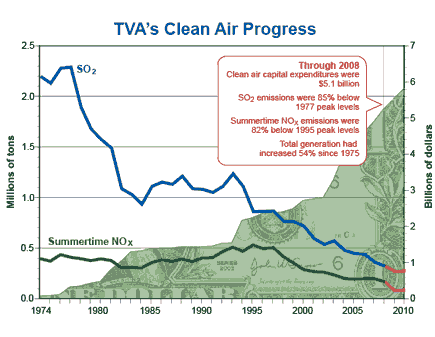
Fiscal Year |
SO2 |
NOx |
Billions of dollars |
1974 |
2212 |
395 |
.073 |
1975 |
2144 |
371 |
.085 |
1976 |
2292 |
434 |
.116 |
1977 |
2303 |
410 |
.327 |
1978 |
1906 |
394 |
.353 |
1979 |
1690 |
376 |
.430 |
1980 |
1587 |
393 |
.473 |
1981 |
1501 |
377 |
.800 |
1982 |
1100 |
305 |
1.025 |
1983 |
1043 |
310 |
1.298 |
1984 |
948 |
303 |
1.323 |
1985 |
1124 |
356 |
1.388 |
1986 |
1167 |
384 |
1.400 |
1987 |
1145 |
370 |
1.400 |
1988 |
1226 |
392 |
1.438 |
1989 |
1101 |
365 |
1.438 |
1990 |
1095 |
404 |
1.439 |
1991 |
1063 |
405 |
1.448 |
1992 |
1125 |
464 |
1.531 |
1993 |
1249 |
508 |
1.545 |
1994 |
1124 |
469 |
2.166 |
1995 |
876 |
530 |
2.238 |
1996 |
877 |
494 |
2.358 |
1997 |
880 |
505 |
2.371 |
1998 |
777 |
414 |
2.406 |
1999 |
776 |
353 |
2.489 |
2000 |
730 |
286 |
2.712 |
2001 |
609 |
269 |
2.762 |
2002 |
551 |
262 |
2.801 |
2003 |
585 |
236 |
3.278 |
2004 |
493 |
200 |
3.966 |
2005 |
460 |
191 |
4.409 |
2006 |
453 |
198 |
4.599 |
2007 |
374 |
196 |
4.880 |
2008 |
336 |
168 |
5.100 |
2009 |
281 |
78 |
5.540 |
2010 |
290 |
86 |
5.800 |
SO2 emission rate
SO2 emissions per GWh of total TVA generation is
an indicator of air quality in the TVA region and a measure of
TVA's diverse generation mix (fossil, nuclear, hydro, solar, wind,
and natural gas). It is also a measure of TVA's success in achieving
its planned SO2 reductions through fuel switching and the addition
of new scrubbers.
Scale does not start at zero, making data variation more apparent. Prior to 2004, figures were based on calendar year.
| Fiscal Year | Actual |
Goal |
2003 |
3.74 |
|
2004 |
3.22 |
|
2005 |
2.80 |
|
2006 |
3.00 |
|
2007 |
2.40 |
|
2008 |
2.15 |
2.49 |
Ozone season NOx emission rate
The measure of NOx emissions per GWh of total TVA generation during the ozone season is part of an indicator of air quality in the TVA region, as well as a measure of TVA's diverse generation mix (fossil, nuclear, hydro, solar, wind, and natural gas). It is also a measure of TVA's success in achieving its planned NOx reductions through the addition of new selective catalytic reduction (SCR) systems and selective non-catalytic reduction (SNCR) systems.
At some TVA plants, emissions have already been reduced through the use of low-sulfur coals and combustion controls. Additionally, TVA is adding more renewable and non-carbon-generating sources to its power system. Along with energy efficiency programs, these actions will significantly improve the environmental footprint of TVA’s operations.

Ozone season is May 1 through September 30. TVA began year-round operation of NOx controls on October 1, 2008, to further reduce its emissions.
| Fiscal Year | Actual |
Goal |
2003 |
1.25 |
|
2004 |
0.72 |
|
2005 |
0.61 |
|
2006 |
0.62 |
|
2007 |
0.59 |
|
2008 |
0.57 |
0.59 |
 Water resource protection and improvement
TVA manages an integrated river system for multiple uses while striving to provide clean and sufficient water for the Valley’s needs.
Clean Marina Initiative
There are 235 marinas on the Tennessee River system. This indicator shows the number of these marinas certified each year, including both new certifications and periodic recertifications of previously certified marinas. This effort promotes sound, environmentally responsible marina and boating practices.
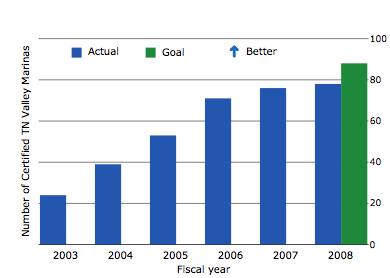
Increases in FY 2006-08 were due to changes in marina ownership.
| Fiscal Year | Actual |
Goal |
2003 |
24 |
|
2004 |
39 |
|
2005 |
53 |
|
2006 |
71 |
|
2007 |
76 |
|
2008 |
78 |
88 |
Minimum flow achievement
TVA maintains minimum water flows at 29 locations
to improve water quality, reduce negative environmental effects
on aquatic life, and support healthy drinking water for Valley
citizens. The chart percentages represent the sum of days
at all locations when flow goals are met divided by the total number
of days possible.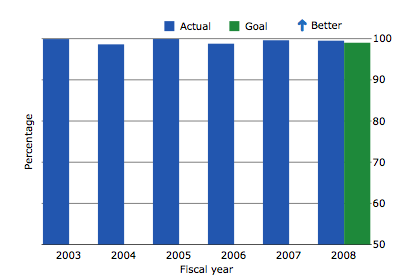
Scale does not start at zero, making data variation more apparent.
| Fiscal Year | Actual |
Goal |
2003 |
99.89 |
|
2004 |
98.61 |
|
2005 |
99.90 |
|
2006 |
98.77 |
|
2007 |
99.60 |
|
2008 |
99.50 |
99.00 |
Dissolved oxygen
For each of the 15 dams with aeration systems installed,
a planned operating schedule is determined. If a system is operable
on days it is scheduled for use, it is counted as being available.
If it is not available due to an aeration system forced outage
and the dissolved oxygen (DO) falls below the established goal,
it is counted as "DO deficit due to forced outage."
| Fiscal Year | Actual |
Goal |
2003 |
20.05 |
3.0 |
2004 |
2.5 |
10 |
2005 |
0 |
3.0 |
2006 |
3.0 |
3.0 |
2007 |
2.25 |
3.0 |
2008 |
1.65 |
3.0 |
Tailwater quality gap
This is an indicator of biological conditions downstream of selected TVA dams. Tailwater quality gap is based strictly on fish community, but is considered an indirect measure for multiple environmental variables, such as DO and flows. This tracking helps to meet the primary goal of TVA's reservoir releases impact program, ensuring DO and flows are at or above target levels. The measure represents the difference between the sum of all tailwater ratings (good, fair, or poor) and an ideal situation where all sites are rated good.

The increase in FY 2008 was due to the negative impacts of dry conditions on the ecological health ratings of many reservoirs. The indicators most responsive to hydrological conditions are dissolved oxygen and chlorophyll.
| Fiscal Year | Actual |
Goal |
2003 |
48.2 |
|
2004 |
47.1 |
|
2005 |
44.7 |
|
2006 |
45.9 |
|
2007 |
44.7 |
|
2008 |
47.1 |
55 |
Reservoir water quality gap
This is an indicator of overall water quality conditions and the health of major reservoirs operated by TVA. It provides information for meeting TVA’s goal of improving watershed water quality and is one of the key drivers for targeting watershed work and evaluating long-term performance. It represents the difference between the sum of all reservoir site ratings (good, fair, or poor) and an ideal situation where all sites are rated good.

The increase in FY 2008 was due to the negative impacts of dry conditions on the ecological health ratings of many reservoirs. The indicators most responsive to hydrological conditions are dissolved oxygen and chlorophyll.
| Fiscal Year | Actual |
Goal |
2003 |
45.8 |
|
2004 |
43.4 |
|
2005 |
37.7 |
|
2006 |
37.7 |
|
2007 |
38.8 |
|
2008 |
41.7 |
38.8 |
Stream water quality gap
This is an indicator of overall water quality conditions and health of streams draining into the Tennessee River system. This measure provides information for meeting TVA’s goal of improving watershed water quality and is one of the key drivers for targeting watershed work and evaluating long-term performance. It represents the difference between the sum of all stream ratings (good, fair, or poor) and an ideal situation where all sites are rated good.

Scale does not start at zero, making data variation more apparent.
| Fiscal Year | Actual |
Goal |
2003 |
33.3 |
|
2004 |
33.7 |
|
2005 |
32.1 |
|
2006 |
31.1 |
|
2007 |
31.0 |
|
2008 |
31.5 |
33.0 |
Spills to water
Spills to water are spills of petroleum products
or hazardous substances beyond established reportable quantities
to waters of the United States. This measure is also tracked
in the Reportable Environmental Event (REE) indicator, which includes
Notices of Violations, Spills to Water, Clean Water Act Nonconformances,
and Reportable Quantity Releases.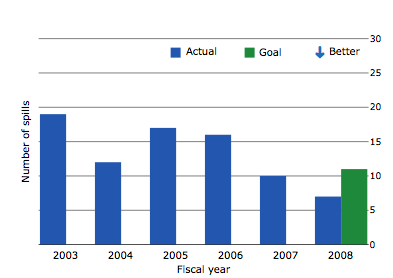
| Fiscal Year | Actual |
Goal |
2003 |
19 |
|
2004 |
12 |
|
2005 |
17 |
|
2006 |
16 |
|
2007 |
10 |
|
2008 |
7 |
11 |
 Waste Minimization
TVA surveys all aspects of its operational and business functions to implement ways to reduce waste and increase recycling.
Office recyclables
This indicator tracks the amount of recyclable materials coming from office-type environments. These include paper, glass, aluminum, cardboard, plastic, and steel from cans. TVA is working to communicate the importance of recycling office materials to new employees, as well as reinforcing the practice to existing employees through its internal newsletter.
The downward trend in recent years was due to the recycling vendor's filing for bankruptcy. TVA has since identified multiple vendors it can use to strengthen its recycling effort.
| Fiscal Year | Actual |
Goal |
2003 |
2,649 |
|
2004 |
1,440 |
|
2005 |
1,805 |
|
2006 |
1,959 |
|
2007 |
996 |
|
2008 |
647 |
983 |
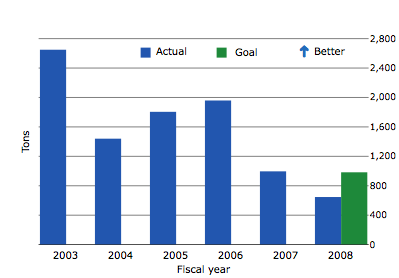
Coal combustion by-products recycled
This is a measure of the amount of coal combustion
by-products (fly ash, bottom ash, and scrubber gypsum) from fossil
plant sites that are recycled.
Figures are based on calendar year. TVA's coal combustion by-products are sold for the manufacture of building products like wallboard, roofing, cement, ready-mix concrete, and other concrete products. The decrease in by-product recycling in CY 2007 is primarily due to planned and unplanned generation outages during prime construction season. The decrease in CY 2008 is due to the effects of the economic downturn on new home and commercial construction. Scale on chart does not start at zero, making data variation more apparent.
Calendar Year |
Actual |
Goal |
2003 |
2.87 |
|
2004 |
2.88 |
|
2005 |
3.10 |
|
2006 |
3.82 |
|
2007 |
3.56 |
|
2008 |
2.52 |
2.80 |
Hazardous waste disposed
Hazardous waste is a material that meets certain
characteristics such as flammability, corrosivity, reactivity,
or toxicity or is specifically designated by environmental regulations.
Figures are based on calendar year. Hazardous waste is measured in kilograms in TVA’s regulatory reporting.
| Calendar Year | Actual |
2003 |
72.10 |
2004 |
115.70 |
2005 |
44.50 |
2006 |
177.22 |
2007 |
224.34 |
2008 |
64.30 |
Low-level radioactive waste generated
Low-level radioactive waste includes ion-exchange
resins, compactable and non-compactable trash, mechanical filters,
tank residue, and irradiated reactor components. This measure reflects
the total volume generated from operational
and maintenance activities, expressed in cubic meters.
Increased low-level radioactive waste generation in FY 2008 was due to plant-wide cleanup efforts and unplanned outages at all three plants. Scale does not start at zero, making data variation more apparent.
| Fiscal Year | Actual |
Goal |
2003 |
980.4 |
|
2004 |
867.0 |
|
2005 |
953.9 |
|
2006 |
753.6 |
|
2007 |
1,618 |
|
2008 |
1,673 |
920 |
Scrap metal
This element tracks the amount of scrap metal picked up by vendors. The amount of scrap metal TVA creates each year is related to the number of projects at the plant sites. Since TVA recycles almost 100 percent of the scrap metal it creates, this is both a measure of how many tons were created and how many tons were recycled.

| Fiscal Year | Actual |
Goal |
2003 |
8.667 |
|
2004 |
15.416 |
|
2005 |
12.355 |
|
2006 |
11.231 |
|
2007 |
12.251 |
|
2008 |
10.493 |
8.0 |
 Sustainable Land Use
TVA manages public lands for multiple benefits, striving to keep them in good environmental health while balancing the need for sustainable development.
Shoreline condition: miles stabilized
TVA is the steward of 11,000 miles of shoreline in the Valley along the Tennessee River. This measure tracks the number of miles of shoreline where the condition was improved through TVA-initiated activities.

The downward trend since FY 2005 is due to a decrease in funds allocated for this type of stewardship activity.
| Fiscal Year | Actual |
Goal |
2003 |
8.80 |
|
2004 |
5.33 |
|
2005 |
8.01 |
|
2006 |
6.34 |
|
2007 |
4.28 |
|
2008 |
3.16 |
2.96 |
Accidental releases to land
Spills to land are accidental releases of petroleum products (oil, gasoline, diesel, lubricating oil, transformer oil, or fuel oil) or other hazardous substances beyond established reportable quantities at a TVA facility or related TVA operations. These are single releases beyond secondary containment that are immediately cleaned up and do not result in remediation projects. This measure is also tracked in the Reportable Environmental Events (REE) indicator, which includes Notices of Violations, Spills to Water, Clean Water Act Nonconformances, and Reportable Quantity Releases .
| Fiscal Year | Actual |
Goal |
2003 |
5 |
|
2004 |
0 |
|
2005 |
0 |
|
2006 |
2 |
|
2007 |
0 |
|
2008 |
2 |
2 |
 Natural Resource Management
TVA protects natural resources while providing recreational opportunities across the Valley.
Dispersed recreation site assessment
TVA monitors its recreation areas to gain a better understanding of the types of activities occurring on TVA-managed land and how it is impacted by these activities. The assessments include only new sites, which accounts for the variation in number from year to year. This type of measure aids TVA in decision making and developing policies for managing various levels of impacts.

| Fiscal Year | Actual |
2006 |
223 |
2007 |
272 |
2008 |
190 |
Number of trees planted
TVA’s tree-planting program supports a variety of goals that include land management, watershed protection, environmental improvement, soil erosion control, land reclamation, and enhancement of wildlife habitat and reservoir shoreline. The deep root systems of trees bind and hold soil in place, provide shade to moderate water temperatures and levels of dissolved oxygen, and provide cover for fish and invertebrates.
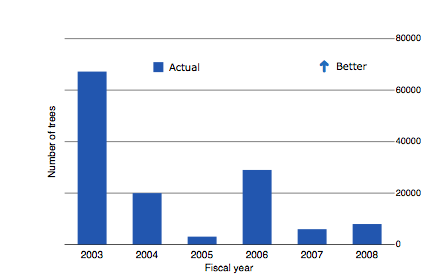
Trees are planted in support of other program goals as needs are identified. Variation in numbers from year to year reflects differences in program requirements.
| Fiscal Year | Actual |
2003 |
67,200 |
2004 |
20,000 |
2005 |
3,100 |
2006 |
29,000 |
2007 |
6,000 |
2008 |
8,000 |
 Compliance
Reportable environmental events (REEs)
This is a measure of events occurring at a TVA facility
or elsewhere that were caused by TVA or TVA contractors, violate
regulatory requirements, and trigger an oral or written notification
to, or enforcement by, a regulatory agency. TVA tracks these
events as part of its commitment to comply with regulations and
policies that are in place to ensure protection of the environment. REEs
include Notices of Violations, Spills to Water, Clean Water Act
Nonconformances, and Reportable Quantity Releases.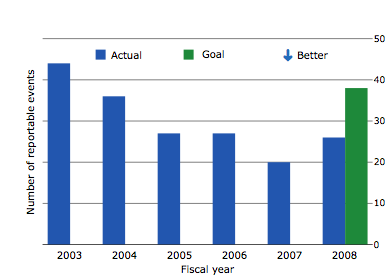
| Fiscal Year | Actual |
Goal |
2003 |
44 |
|
2004 |
36 |
|
2005 |
27 |
|
2006 |
27 |
|
2007 |
20 |
|
2008 |
26 |
38 |
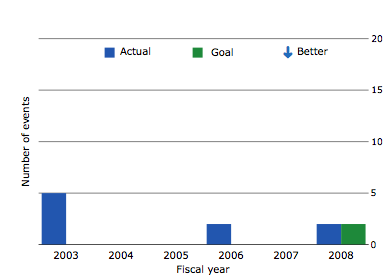
Regulatory enforcement actions
This measure reflects the number of regulatory actions
issued against TVA. There were two regulatory enforcement actions in FY 2008: (1) A Notice of Violation was received from the Georgia Environmental Protection Division for the Center Point-Tilton 230-kV Transmission Line work being performed in Whitfield County. Georgia EPD cited four violations of the General Permit requirements; (2) Johnsonville Fossil Plant received a Notice of Violation for the improper storage and labeling of two storage boxes containing used four-foot fluorescent bulbs. 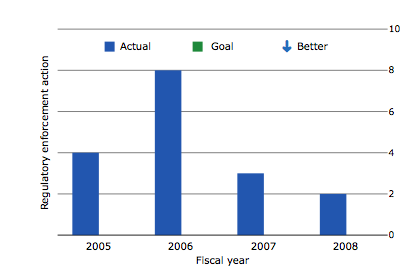
| Fiscal Year | Actual |
Goal |
2005 |
4 |
|
2006 |
8 |
|
2007 |
3 |
|
2008 |
2 |
0 |
![]()