 |
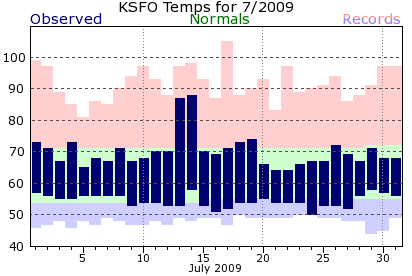
| KSFO July, 2009 |
| Date | Observed
Low
(F) | Observed
High
(F) | Normal
Low
(F) | Normal
High
(F) | Record
Low
(F) | Year | Record
High
(F) | year |
Observed
Precipitation
(inches) |
Record
Precipitation
(inches) |
| 1 | 57 | 73 | 54 | 71 | 46 | 1949 | 99 | 1985 |
0 | 0.01 1980 |
| 2 | 56 | 71 | 54 | 71 | 47 | 1954 | 97 | 1970 |
0 | 0.35 1977 |
| 3 | 55 | 67 | 54 | 71 | 48 | 1953 | 89 | 1970 |
0 | 0.01 1955 |
| 4 | 55 | 73 | 54 | 71 | 46 | 1954 | 85 | 1973 |
0 | 0 |
| 5 | 56 | 65 | 54 | 71 | 48 | 1965 | 81 | 1981 |
0 | 0 |
| 6 | 56 | 68 | 54 | 71 | 47 | 1953 | 86 | 1957 |
0 | 0 |
| 7 | 56 | 67 | 54 | 71 | 49 | 1955 | 85 | 1985 |
0 | 0 |
| 8 | 56 | 71 | 54 | 71 | 48 | 1951 | 90 | 1985 |
0 | 0.23 1974 |
| 9 | 53 | 67 | 54 | 71 | 47 | 1953 | 94 | 1959 |
0 | 0.01 1945 |
| 10 | 54 | 68 | 54 | 71 | 47 | 1953 | 97 | 1959 |
0 | 0 |
| 11 | 54 | 70 | 54 | 71 | 48 | 1998 | 93 | 1983 |
0 | 0 |
| 12 | 53 | 70 | 54 | 71 | 47 | 1950 | 88 | 1983 |
0 | 0 |
| 13 | 53 | 87 | 54 | 71 | 49 | 1981 | 97 | 1972 |
0 | 0 |
| 14 | 58 | 88 | 54 | 71 | 48 | 1950 | 98 | 1972 |
0 | 0 |
| 15 | 53 | 70 | 54 | 71 | 49 | 1962 | 93 | 1995 |
0 | 0.13 1975 |
| 16 | 51 | 69 | 55 | 71 | 49 | 1949 | 87 | 1988 |
0 | 0.01 1990 |
| 17 | 52 | 71 | 55 | 71 | 47 | 1954 | 105 | 1988 |
0 | 0 |
| 18 | 54 | 73 | 55 | 71 | 50 | 1999 | 88 | 1968 |
0 | 0.01 2007 |
| 19 | 54 | 74 | 55 | 71 | 49 | 1981 | 90 | 1961 |
0 | 0 |
| 20 | 55 | 66 | 55 | 71 | 49 | 1981 | 93 | 1996 |
0 | 0.03 1985 |
| 21 | 54 | 64 | 55 | 71 | 49 | 1954 | 83 | 2006 |
0 | 0.09 1979 |
| 22 | 54 | 64 | 55 | 71 | 49 | 1981 | 97 | 2006 |
0 | 0 |
| 23 | 54 | 66 | 55 | 71 | 50 | 1981 | 89 | 2005 |
0 | 0.01 1986 |
| 24 | 50 | 67 | 55 | 71 | 50 | 2009 | 90 | 1974 |
0 | 0 |
| 25 | 53 | 67 | 55 | 71 | 49 | 1953 | 91 | 1973 |
0 | 0.15 1946 |
| 26 | 53 | 72 | 55 | 71 | 49 | 1951 | 94 | 1963 |
0 | 0 |
| 27 | 52 | 69 | 55 | 71 | 48 | 1951 | 86 | 1967 |
0 | 0 |
| 28 | 56 | 67 | 55 | 71 | 48 | 1953 | 88 | 1954 |
0 | 0 |
| 29 | 58 | 71 | 55 | 72 | 44 | 1951 | 91 | 1977 |
0 | 0 |
| 30 | 57 | 68 | 55 | 72 | 45 | 1954 | 97 | 1977 |
0 | 0.03 1966 |
| 31 | 56 | 68 | 55 | 72 | 49 | 1956 | 97 | 1993 |
0 | 0.02 1949 |
| Average | 54.5 |
70.0 |
54.5 |
71.1 | |
0
Normal = 0.03 |
|
The above data is unofficial and may contain errors.
For official climate records, please contact...www.ncdc.noaa.gov.
Return to Climate Charts Web page.
|
|
|
Webmaster
US Dept of Commerce
National Oceanic and Atmospheric Administration
National Weather Service
San Francisco/Monterey Bay Area Weather Forecast Office
21 Grace Hopper Ave, Stop 5
Monterey, CA 93943-5505
Tel: (831)-656-1725
|
Disclaimer
Information Quality
Credits
Glossary |
Privacy Policy
Freedom of Information Act
About Us
Career Opportunities
|


