- Info
OVERVIEW
The A-Train Data Depot (ATDD) has been developed to process, archive, allow access to, visualize, analyze and correlate distributed atmospheric measurements from A-Train instruments. The ATDD portal provides easy on-line data access and services for science, applications, and educational use so that users get exactly the data they want, and not large files of data which would take much time and effort by individuals to be co-registered and refined.
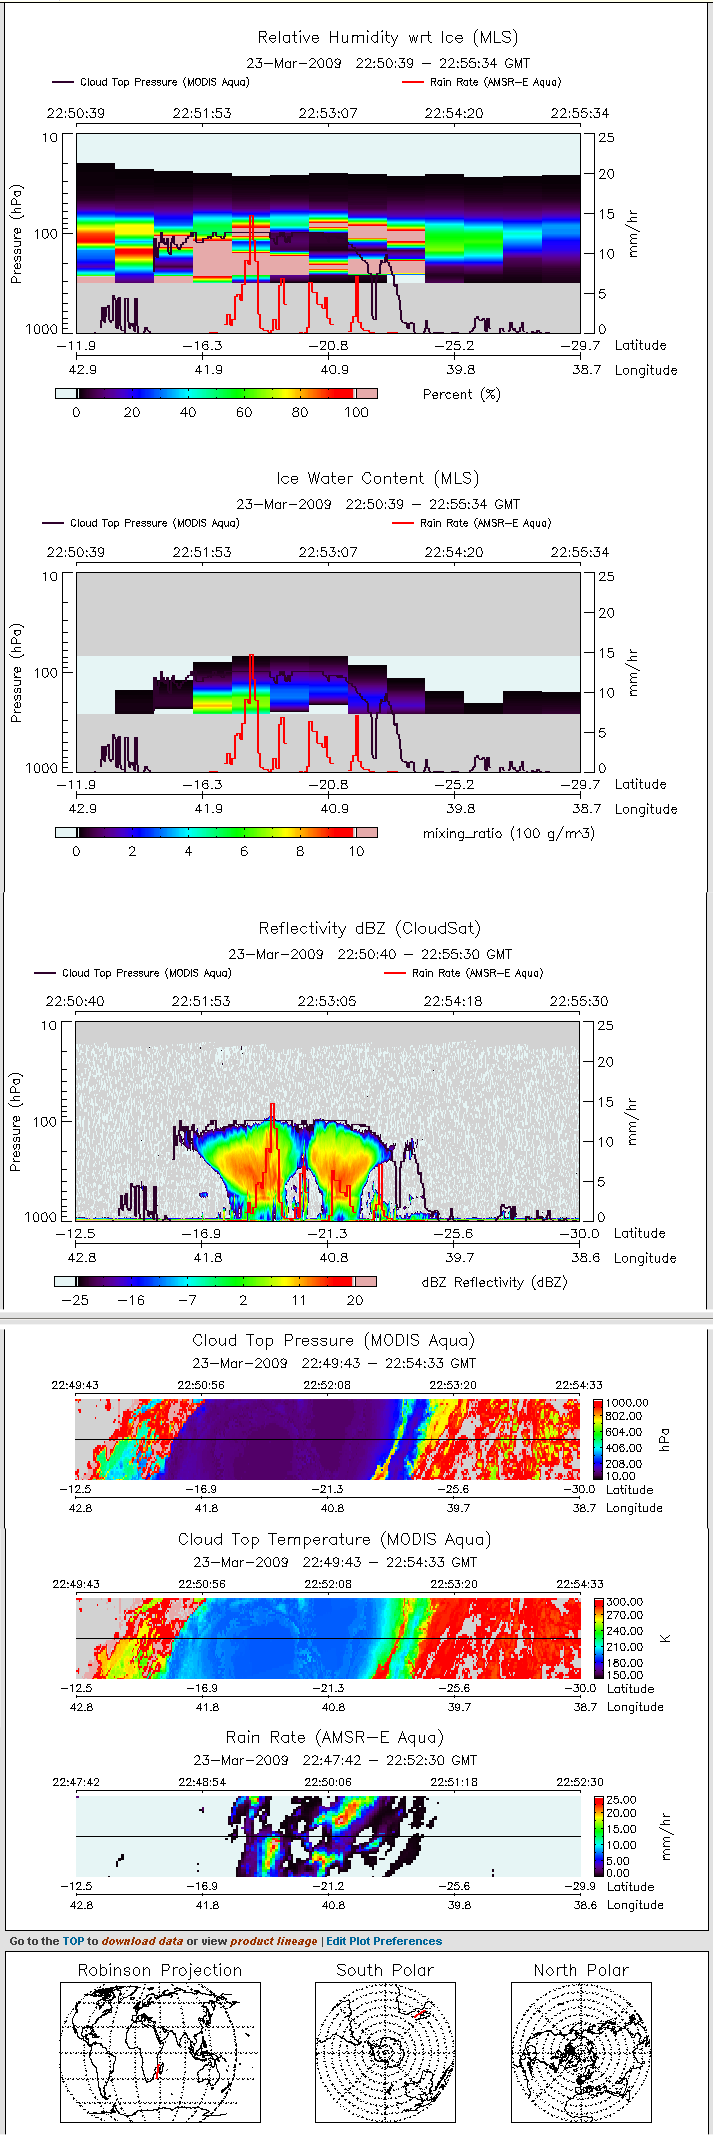
| During its brewing phase on March 23, the tropical depression Izilda revealed an interesting two-core convective system, clearly captured by the CloudSat's vertical profiles (left). In the next couple of days, the depression organized better, to reach Tropical Storm status with sustained winds of 60 miles/hr (see imagery from MODIS rapidfire). The snapshot on the left demonstrates the utility of the Giovanni web plotting tool to quickly preview data from such extreme events. The plot shows collocated data from MODIS, CloudSat, MLS, and AMSR-E. The plots of Relative Humidity with respect to Ice (RHI), as well as Ice Water Content (IWC), from MLS indicate significantly enhanced atmospheric moisture overshooting the tropopause.
Thanks to CloudSat, the source of the moisture is easy to collocate with and attribute to the storm. Water vapor is the most potent greenhouse gas, and its concentration will only grow if global temperatures keep rising.
|
A-Train Data Depot:


