IV. Simple Tools for Checking Image Data Quality
The imaging process is not perfect and noise is always present from the:
- Solar illumination
- Atmosphere
- Earth surface target interactions
- Imaging system (including platform)
- Analysis
A fundamental question that investigators must ask themselves following data collection and before image analysis is: Is the data worth analyzing? There are simple checks investigators can perform to assess data for an idea as to its fidelity. Keeping the S/N model in mind, the investigator must continually ask if the data "makes sense".
Step 1: Check the header for correct data collection conditions and settings. Some of the following information may not always be available. Is the imagery correct for:
- date
- time
- location
- units
- calibration file date
- GPS datum
- GIFOV
- platform airspeed
- platform altitude
- aircraft type and tail number
- pilot name
- instrument operator(s)
Operator notes, both written and verbal (via recordings of cabin intercom conversations via a tape recorder or audio track of a VCR) are also useful. Pay particular attention to notations and times of radio contact with other aircraft or air traffic control as radio transmission has been known to cause radio frequency (RF) interference of imagery.
Step 2: Make "quicklook" false color pictures using standard color infrared assignments: B,G,NIR bands. Briefly examine each spectral band in black and white. For hyperspectral data, a sampling of spectral bands across visible-blue, visible-green, visible-red, several near infrared, and several short wave infrared bands are suggested.
Look for:
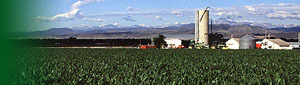
- Indications that the general location of the coverage is correct such as known features of the landscape
- clouds
- cloud shadows?
- Odd features?
- Imaging characteristics?
- Noise level?
- Do the features present seem reasonable given your knowledge of the landscape?
- Do any anomalies indicate possible problems with the system, calibration, or platform?
- Are there "blooms" or either dark or light/white areas that mask surface detail?
- Is there a gradient of light to dark or dark to light at one of the edges of the image?
These could indicate the need for additional calibration steps, or hardware problems.
Step 3: Assess the locational and cartographic/geometric fidelity of the imagery. Locational accuracy of imagery is easiest to determine given analyst knowledge of the landscape - look for familiar features and ask yourself if they appear as they should. Geometric rectification of imagery is easiest to ascertain if a GIS shape file is generated using surface-based differential GPS and then overlain on the imagery.
- Does the GPS record indicate the correct location was flown?
- Are landscape features positioned where they should be relative to each other?
- Are straight-line features such as roads, railroad tracks, etc., showing up as straight lines?
- Do curved features have their characteristic gradual or sharp curvature?
- Does the image appear to have been taken from a level platform with minimal roll, pitch, and yaw?
If the system is equipped with an Inertial Navigation System (INS), roll, pitch and yaw are measured and logged every couple of scan lines. The INS data coupled with the GPS data permits a very good first order geometric rectification. However, there will still be some minor locational errors of no more than 2-3 pixels at high spatial resolution (1-4 m)
Step 4: Print histograms of each spectral band image. Histograms provide a snapshot of radiometric values for an entire spectral image. Examine the histograms for:
- shapes relative to scene contents?
- shapes relative to each band?
- continuous or with noticeable dropouts?
- units consistent?
- range of values?
Are the histogram distributions univariate, bivariate, normally distributed, skewed, continuous? Are the distributions continuous or are there ranges of values missing that indicate a hardware problem? Are the values high or low according to what one would expect from the spectral band being examined? Are the amplitudes consistent with the units?
Given an image dominated by plant canopies, the histogram for VIS-red should be show the majority of the values to be fairly low. The opposite would be true for NIR values. Very low NIR values should be present if there are clear water bodies present. Conversely, the presence of clouds would show up as high values across all spectral bands.
Do these histograms seem reasonable based on what you already know about the landscape and the conditions under which the data was collected?
Step 5: Extract pixel values across all spectral bands for familiar features and plot the signatures. A major tenet of remote sensing is that information about a target on the earth's surface is available from any altitude. Look at the signatures and assess whether or not they look like something familiar from your knowledge of the literature or from ground-based measurements using field-portable instrumentation. Suggested features are:
- dense vegetation - crops, trees, etc.
- turf grass
- low percent cover vegetation with some soil showing through
- bare soil
- blacktop roadways
- deep waterbodies
- concrete surfaces
Plant canopies should have the familiar plant canopy signature. Bare soil should have the characteristic "ramp-like" signature. Compare vegetation signatures -crops versus dense tree canopies for example. The chlorophyll absorption well in the red and the NIR plateau should be especially useful. Blacktop surfaces should appear very low in reflectance across VIS and NIR wavelengths. The low reflectance targets should be useful as places where noise problems will occur. The 3% - 5% low reflectance of full cover plant canopies is especially tough for remote sensing systems to handle.
Do these signatures seem reasonable based on what you already know?
|