Skip all navigation and jump to content Jump to site navigation Jump to section navigation.
NASA Logo - Goddard Space Flight Center + Visit NASA.gov
HOME PROJECTS RESOURCES SEARCH MAP

+ Advanced Search
Home
Home
View Most Recently Released Imagery
View Gallery of Imagery: A topical collection of SVS Imagery
Search Imagery by the keywords assigned to it
Search Imagery by the instruments that supplied data for a visualization product
Search Imagery by the series of visualizations that have been produced
Search Imagery by the scientist providing the data used in a visualization product
Search Imagery by the animator that created the product
Search Imagery by the identification number assigned to the visualization product
See other search options
Learn about the SVS Image Server
  + About the Server
  + Animation List
  + How to Use the Server


  + RSS Feeds
  + Podcasts


  + Opportunities
blank image
The Ten Most Popular Scientific Visualization Studio Items on svs.gsfc.nasa.gov in the Past Week

Other Popular Items on svs.gsfc.nasa.gov:
 
This movie shows the orbits of the fleet of NASA spacecraft exploring the heliosphere.For complete transcript, click here.
Sentinels of the Heliosphere
Number of hits: 30233
 
LRO orbit insertion with elapsed time since launch
Lunar Reconnaissance Orbiter (LRO) Orbit Insertion
Number of hits: 6395
 
This image shows Circum-Arctic permafrost, MODIS Daily Snow Cover and Sea Ice Surface Temperature over the Arctic region on 5/19/2003.
A Tour of the Cryosphere
Number of hits: 6149
 
This data visualization of five-year global temperature differences from 1880 to 2008 was designed to be shown on the Science On A Sphere. Dark blue areas show regions where the temperature was cooler then the average temperature. Red areas show regions where the temperature was warmer then the average. This particular image show the global average from 2004 to 2008.
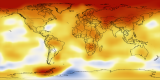
Five-Year Average Global Temperature Anomalies from 1880 to 2008 for Science on a Sphere
Number of hits: 5594
 
Towers in the Tempest - full narrated version
Towers in the Tempest
Number of hits: 4426
 
MMS dayside magnetosheath/magnetopuase orbit configuration
Magnetospheric Multiscale Mission (MMS) Dayside Orbit Animation for the Preliminary Design Review (PDR)
Number of hits: 3934
 
This image represents a one month sample (October 1983) of composite images from cloud cover data collected from a suite of U.S., European, and Japanese geostationary satellites and U.S. polar orbiting meteorological satellites.
The HoloGlobe Project (Version 3)
Number of hits: 3563
 
Annual Arctic sea ice minimum for 1979 to 2007
Sea Ice Yearly Minimum 1979-2007
Number of hits: 3475
 
This animation shows where the world's food is grown versus where the world's food is consumed.  The movie starts with global croplands and then fades to the countries that produce over 80% of the world's wheat, grain, and cereal. It then overlays the world's population density and then fades to show the countries that are projected to double and triple their population by 2050.
Global Agricultural Monitoring
Number of hits: 3474
 
Our Solar System
Earth Today 1998
Number of hits: 3448

USA.gov logo - the U.S. Government's official Web portal. + Privacy Policy and Important Notices
+ Reproduction Guidelines
NASA NASA Official:
SVS Contact:
Curator: