Blue Mountain Forests' Monitoring Report - FY 98
Section C - Combined/Coordinated Monitoring Items
TABLE OF CONTENTS
LIST OF TABLES AND FIGURES
|
MONITORING ITEM: Air Quality (top)
(Monitoring Items: Malheur 31, Umatilla 1, Wallowa-Whitman
22)
Questions: Did the Forests meet the reporting obligations under the Oregon State Implementation Plan and the Northeast Oregon Smoke Management Memorandum of understanding (MOU)? Were emissions under the cap established for Northeastern Oregon (currently 15,000 tons per year of PM10).
Questions: Did prescribed burning on the Forests result in any smoke intrusions on La Grande (Special Protection Zone) or smoke impacts to other population centers? If so, where and when were they, and what was the cause (if known)? Impacts are defined as smoke entering the community at the ground level.
The National Forests of northeast Oregon met the reporting obligations to the Oregon Department of Forestry (ODF) during calendar year (CY) 1998. Unique problems occurred with the reporting system this year as the Forest Service changed computer systems. Because of interface problems with the new computer system, the ODF is still compiling the accomplishment record. The preliminary information would indicate the PM10 emissions from timbered acres, as addressed in the Northeast Oregon Smoke Management MOU, were well below the 15,000-ton cap.
On the Malheur National Forest, not all fuels treatments are accomplished with prescribed burning. Fuels treatment may be defined as reducing the fire hazard within a given area in a variety of ways, such as crushing, removing the fuels from the site, lop and scatter, piling, etc. The numbers displayed below are treated acres; not all acres are treated by prescribed burning. For example, of the 36,124 acres treated in 1998, prescribed fire was applied to 12,130 acres.
Emissions trend (from acres actually treated by prescribed burning) and acres treated (all treated acres) for years 1993 through 1998 are listed below.
Table C-1
EMISSIONS TREND
Malheur National Forest
| Year | Acres Treated | PM 10 | BD Acres | Natural Fuels Acres |
| 1993 | 6,133 | 889 | 5,286 | 847 |
| 1994 | 8,117 | 456 | 3,658 | 4,432 |
| 1995 | 11,218 | 1,635 | 6,681 | 4,537 |
| 1996 | 18,019 | 1,930 | 5,684 | 12,335 |
| 1997 | 32,142 | 3,553* | 9,392 | 22,750 |
| 1998 | 36,124 | 1,882 | 9,159 | 26,965 |
* The relatively high PM10 calculations in 1997 were the result of incorrectly entering the burned acres into the Smoke Management System. Correct results may be seen in the 1998 values. |
As treated acres increase, PM10 emissions increase. The rate of change, however, indicates the 15,000- ton cap should not impede the fuels treatment program if treatment methods and acres remain relatively constant.
The Malheur NF did not record impact to any Special Protection Zones. However, the Forest did receive numerous smoke complaints during the end of April and the first part of May. Close coordination with Oregon Department of Environmental Quality (DEQ), Bend Field Office, was maintained. Several prescribed burns were canceled during this period of poor visibility. Eventually, the cause of the "intrusion" was determined to be dust from a wind storm in China.
Other complaints were received from the public in Seneca, Juntura, and Burns. As soon as the complaints were received, burning was adjusted to alleviate the situation. Even though complaints were received from the Burns area, the nephelometer readings indicate no abnormal or high readings occurred. Nephelometer data were not available at the other sites.
In CY 1998, several prescribed burning activities were used to accomplish management objectives on the Umatilla NF for hazard reduction, site preparation, range improvement, and wildlife enhancement. Based on averaged fuel moistures, fuel types, and acres burned, the total tons of fuel consumed and suspended particulate emissions produced are estimated for the Forest at levels shown in Table C-2. The total 938 tons of emissions produced by the Umatilla was further estimated as 804 tons from prescribed burning in Oregon and 134 tons from prescribed burning in Washington.
Table C-2
PM10 EMISSIONS - CY 1991-1998
Umatilla National Forest
Year |
Total Fuel Consumed (Tons) |
Particulate Produced (Tons) |
1998 |
63,115 |
938 |
1997 |
95,747 |
1,388 |
1996 |
53,720 |
779 |
1995 |
35,002 |
507 |
1994 |
96,235 |
1,396 |
1993 |
66,852 |
969 |
1992 |
156,436 |
2,268 |
1991 |
178,811 |
2,593 |
As seen in Table C-2, the amount of prescribed burning and particulates decreased from 1997. The decreased emission is not an indication of fewer acres burned in total, but is due to a larger portion of the burning occurring in "natural fuels" rather than "activity fuels." Activity fuels burning occurs in more concentrated fuel beds after a timber harvest operation, thereby producing more tons of fuel consumed per acre.
No smoke intrusions were identified for La Grande in 1998. One intrusion was documented in Baker City, Oregon. The specifics of the Baker City intrusion are shown in Table C-3.
Table C-3
SMOKE INTRUSIONS -- 1998
Malheur, Umatilla, and Wallowa-Whitman National Forests
| No./ Date |
District/ Forest | Area Affected | Total Tons | Mixing Depth | Transport Wind | Forecast/ Instruction OK? | Cause | Comments | Intensity | No. of Hours |
| 1E 10/1/98 |
Wallowa-Whitman NF |
Baker City |
1,794 | Unk | S to SW @ 5-15 mph | N/Y | Drift smoke and main plume traveled into town under stable air mass | Wind shifted from south to west later than expected | Light | 2 |
For the Umatilla NF, on September 23, 1998, the Heppner Ranger District ignited a large (landscape) prescribed burn across 6,000 acres. This type of large-scale fall burning has not been done before on the District. Experience during previous spring burns indicated that the inversion would set up low in the canyon and a majority of smoke would not penetrate below it. During the fall burn ignition period, the smoke flowed to the northeast and obtained enough height to avoid any population centers. However, the nighttime inversion resulted in residual smoke flowing into the John Day River drainage. The inversion did not set as low in elevation so that smoke flowed under it and was trapped through the evening and morning hours. The result was a large volume of smoke in the Monument area, in particular. Without a nephelometer in place, the smoke impact could not be quantified in these low population density areas.
All ranger districts on the Umatilla reported that burns were planned and implemented following Forest guidelines and approved by district rangers. One intent of the program was to minimize smoke production and impacts to sensitive areas. Measures to reduce emissions from burns followed the Managing Competing and Unwanted Vegetation EIS and Forest direction and included: scheduling burns during appropriate times to minimize conflicts; igniting burns under conditions conducive to rapid fuel consumption; and prompt mopup of smoldering fuels. The mitigation was effective in reducing emissions and minimizing intrusions associated with burning for the 1998 fire season.
The Wallowa-Whitman National Forest manages two Class I areas, Eagle Cap Wilderness and Hells Canyon Wilderness. The Land Management Plan for the Wallowa-Whitman NF provides that these two areas not be impacted by prescribed fire emissions during the period between July 4 and Labor Day each year. No prescribed burns were conducted by the Forest Service during this period, thus no impacts from Forest Service burning projects occurred.
Recommended Action:
Continue monitoring and coordinating air quality improvement activities. Monitoring and reporting of application and effectiveness of mitigation measures are still needed.
MONITORING ITEM: Forage Utilization (top)
(Monitoring Items: Malheur 21, Umatilla 10, Wallowa-Whitman
13)
Questions: Are actual forage utilization levels within established Forest Plan allowable utilization standards in riparian and/or upland areas as appropriate, particularly within those pastures identified as high priority?
In FY 98, Forest Plan utilization standards continued to be incorporated into the Annual Operating Plans for each allotment on each Forest. On all three Forests, the standards included modifications to comply with Endangered Species Act mitigation for listed fish species. Utilization standards can vary by Forest and allotment.
Table C-4
UTILIZATION MONITORING BY FOREST - FY 98
Malheur, Umatilla, and Wallowa-Whitman National Forests
MALHEUR |
UMATILLA |
WALLOWA-WHITMAN* |
|
| Total number of pastures within active allotments | 422 | 130 |
508 |
| Total number of
pastures monitored* Percent of total pastures monitored |
283** 67% |
107 |
297 |
| Total number of
monitoring data collections Total number of these within riparian areas |
680 386 |
373 |
887 |
| Number of monitored
pastures meeting standards Percent of monitored pastures meeting standards |
261 92% |
104 |
272 |
| Number of monitored
pastures exceeding standards Percent of monitored pastures exceeding standards |
21 7% |
3 |
13 |
| Number of monitored
pastures uncertain Percent of monitored pastures uncertain |
1 <1% |
0 |
12 |
* Note: A pasture grazed more than once during the year may be reported as two pastures. A pasture within an activeallotment, which is scheduled for rest, is considered to be an active pasture. In addition, there are many exclosures andsmall special-purpose pastures. Monitoring in these areas often does not involve utilization sampling but may involve simply a check to ensure that management requirements were met.
** Some partners were monitored that were not in active allotments. They were monitored for use by unauthorized livestock.
Some pastures are not receiving adequate utilization monitoring. This situation is a direct result of continued insufficient funding in the range program.
The Threshold of Variability was not exceeded on the Malheur, Umatilla, or Wallowa-Whitman National Forests.
Recommended Action:
Continue to emphasize utilization monitoring as funding and priorities permit. Permittees on the Wallow-Whitman are, and will continue to be, required to conduct stubble height (utilization) monitoring. The other forests will phase in that practice.
Continue to emphasize effectiveness monitoring to validate utilization standards, with special emphasis on riparian areas.
MONITORING ITEM: Noxious Weeds
(top)
(Monitoring Items: Malheur 22, Umatilla 12, Wallowa-Whitman
17)
Questions: Are noxious weeds being inventoried and managed in accordance with the Regional FEIS for Competing and Unwanted Vegetation, Forest Plan direction, and applicable NEPA decisions? Are treatments effective at meeting objectives defined in the NEPA decisions and/or in associated treatment plans? What are the trends in noxious weed populations?
Both the Umatilla and Wallowa-Whitman National Forests have approved Noxious Weed EAs. These EAs incorporated provisions from the Region 6 FEIS for Managing Competing and Unwanted Vegetation, its Mediated Agreement, and the Forest Plans. The Umatilla's EA was prepared in 1995. The Wallowa-Whitman completed a programmatic Noxious Weed EA and integrated Management Plan in 1992, and in 1994 completed an update to this decision to incorporate additional inventoried sites. Each EA provides the basis for weed treatments on the Forest.
The Umatilla NF has initiated an EIS to build a strategy that "gets out in front" of the noxious weed spread. The strategy incorporates older weed sites, newly inventoried areas and areas of high risk for invasion. The EIS preparation has been delayed due to lack of funding. The Umatilla and Wallowa-Whitman are currently working on a joint EIS for aerial application of herbicides in remote sites. This EIS is expected to be completed in FY 99. The Malheur expects to complete an EA for noxious weed control in FY 2000.
All three Forests treated noxious weed infestations this year and inventoried new sites as well. As in past reporting, new sites probably represent some increased spread of weeds, as well as older sites that have only recently been inventoried. Table C-5 summarizes the existing inventory for the three forests and the type of noxious weed treatment conducted in FY 98.
Table C-5
NOXIOUS WEEDS - INVENTORY AND TREATMENT - FY 98
Malheur, Umatilla, and Wallowa-Whitman National Forests
Gross or |
MALHEUR |
UMATILLA |
WALLOWA-WHITMAN |
|
| Total acres of inventoried noxious weeds | Gross Net |
- |
24,109 |
18,239 |
| Acres newly inventoried in FY 98 | Gross Net |
- |
-- |
-- |
| Acres currently NEPA-approved for treatment | Gross Net |
47 |
4,341 |
3,989 |
| METHODS OF
TREATMENT Manual |
Gross Net |
- |
-- |
283 |
| Mechanical | Gross Net |
- |
0 |
0 |
| Biological ** | Gross Net |
- |
-- |
48 |
| Cultural (incl. prescription fire) | Gross Net |
- |
-- |
0 |
| Chemical | Gross Net |
- |
-- |
1,467 |
| TOTAL TREATED ACRES | Gross Net |
- |
4,341 |
1,838 |
| * Gross acres are the total acres considered to be
"infested." Within the gross acres, the net acres are the land base actually
occupied by noxious weeds. For example, a 10-acre (gross) infestation may be occupied by
widely-scattered individuals that occupy only 5 percent (0.5 net acres) of the area. ** Biological controls released in past years are not reflected here, even though biological agents may still be active and providing ongoing treatment. |
Treatment Effectiveness
Informal monitoring on the Forests continues to indicate that manual control of noxious weeds is often not very effective, especially on established sites and on deep-rooted species or species which spread vegetatively. Informal monitoring indicates that control rates are generally high where herbicides are used, especially when the most effective herbicide can be used. However, on established infestations with substantial seed in the ground, and with the seed capable of sustaining viability over many years, each site will need to be treated and monitored for many years if objectives are to be achieved.
On the Umatilla NF for 1998, two ranger districts reported on treatment effectiveness. On the Heppner Ranger District, all known populations of knapweed, St. Johnswort, scotch thistle, dalmation toadflax, hound's tongue, common burdock, scotch broom, and tansy ragwort were treated. Based on follow-up surveys, hand pulling (grubbing) has kept populations of knapweed and tansy ragwort in check. Canada thistle continues to expand as hand pulling is neither feasible nor effective. During 1998, the North Fork John Day Ranger District revisited and treated virtually all of its active noxious weed sites. Monitoring of treatment effectiveness showed nearly identical results for manual and chemical treatments:
Manual treatments (105 sites ) -- Trends: 30% increase; 50% decrease; and 20% no change
Chemical treatments (47 sites) -- Trends: 29% increase; 46% decrease; and 23% no change
The North Fork John Day Ranger District also noted that a few of the larger sites showed a significant increase in the number of plants for both manual and chemical treatments.
Noxious Weed Trends
Determining trends in noxious weed populations has been difficult. While more infestations are reported each year, it is generally unknown whether these are new sites or established sites that have just recently been found and reported.
The Heppner Ranger District completed an updated inventory of noxious weeds in 1998, focused on roads, trails, and other disturbed sites. Twenty new noxious weed sites were located, including one tansy site. In addition, two new noxious weeds were found, musk thistle and yellow starthistle; each was hand treated. Overall, known weed populations on the Heppner Ranger District are remaining stable. On the North Fork John Day Ranger District, some examples of specific noxious weeds may provide a flavor and range of trends, as follows. Hound's tongue is established on a few areas on the District but aggressive treatment efforts have contained it to those areas. All knapweed sites are currently under control, with many close to eradication. One yellow starthistle plant was found on the District. Aggressive new invader species -- white top, dalmation toadflax, and scotch thistle -- are being treated to eradicate them. The District is experiencing invasion of sulphur cinquefoil and yellow toadflax, which have proven to be aggressive weeds or difficult to successfully treat.
Recommended Actions:
Complete the noxious weed EIS and action plans on the Umatilla NF to more effectively treat weeds in a timely manner.
Continue work on a remote sites aerial application EIS for the Umatilla and Wallowa-Whitman NFs.
Continue to build an aggressive prevention, inventory, treatment, and monitoring program for noxious weeds.
Continue work on the Tri-Forest noxious weed data base.
MONITORING ITEM: Harvest Methods and
Acres (top)
(Monitoring Item: Malheur 26, Umatilla 13, Wallowa-Whitman
5)
Questions: How do the silvicultural harvest methods implemented on the ground compare to predictions from the Forest Plan? Is clearcut acreage going down per the Chief's 1992 direction to reduce clearcutting by 25 percent?
The following table displays silvicultural harvest methods implemented on the ground compared to Forest Plan projections.
Table C-6
SILVICULTURAL HARVEST METHODS (IN ACRES) FOR FY 98
Malheur, Umatilla, and Wallowa-Whitman National Forests
SILVICULTURAL |
MALHEUR |
UMATILLA |
WALLOWA- |
| Clearcut Forest Plan Estimate (acres/year) Actual FY 98 Harvest (acres) Percent (actual/planned) |
|
|
|
| Shelterwood/Seed Tree Forest Plan Estimate Actual FY 98 Harvest Percent (actual/planned) |
|
|
|
| Overwood Removal Forest Plan Estimate Actual FY 98 Harvest Percent (actual/planned) |
|
|
|
| Uneven-age/Selection Forest Plan Estimate Actual FY 98 Harvest Percent (actual/planned) |
|
|
|
| Commercial Thinning Forest Plan Estimate Actual FY 98 Harvest Percent (actual/planned) |
|
|
|
| Salvage/Sanitation Forest Plan Estimate Actual FY 98 Harvest Percent (actual/planned) |
|
|
|
| Special Cut Forest Plan Estimate Actual FY 98 Harvest Percent (actual/planned) |
|
|
|
| TOTAL Forest Plan Estimate Actual FY 98 Harvest Percent (actual/planned) |
|
|
|
Many of the assumptions used to develop Forest Plans are no longer valid; the Forest Service has moved away from regeneration harvest to implement ecosystem restoration objectives. More timber was harvested using commercial thinning and salvaging prescriptions and less with regeneration harvest prescriptions than anticipated in the Forest Plan. These methods will continue to be used as the predominant silvicultural objectives as we continue to focus on forest health and ecosystem restoration.
Table C-7
CLEARCUT ACRES - FISCAL YEARS 1993-98*
Malheur, Umatilla, and Wallowa-Whitman National Forests
YEAR |
MALHEUR |
UMATILLA |
WALLOWA-WHITMAN |
1988 Base |
3,299 |
||
Forest Plan Projection |
3,330 |
4,000 |
3,900 |
1993 |
3,095 |
1,470 |
700 |
1994 |
972 |
195 |
286 |
1995 |
992 |
109 |
80 |
1996 |
265 |
895 |
4 |
1997 |
220 |
419 |
0 |
1998 |
392 |
1,348 |
0 |
| * Monitoring Reports for Fiscal Years 1991 through 1996 displayed acres offered for sale. The Report this year displays actual acres harvested. The table begins with 1993, as sales designed prior to implementing the Forest Plan were harvested in 1991 and 1992; 1993 reflects the first year of fully implementing the Forest Plan. |
For the Umatilla National Forest in 1998, silvicultural harvest methods, total harvest acres, and most individual treatment methods continue to be well below Forest Plan projections. Based upon the Forest Plan Threshold of Variability (more than 25 percent annually), 1998 harvest level totals were 56 percent below the Forest Plan threshold. Overall, total harvest acres for 1998 are down about 37 percent from a year ago; the exceptions include acres of shelterwood/seed-tree harvest methods. Silvicultural prescriptions implemented in 1998 were determined to meet Forest Plan Standards and Guidelines as well as meeting Riparian Habitat Conservation Area widths.
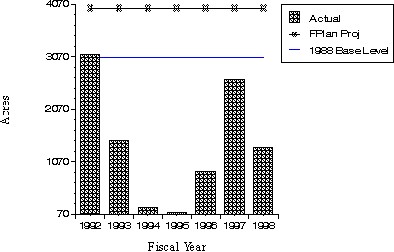
In 1992, the Chief of the Forest Service announced that the amount of clearcut acres would be reduced on National Forest lands by 25 percent based on 1988 levels. Since this announcement, the Umatilla NF has been reducing the amount of actual clearcut acres. The table and chart below display the trend in clearcut acres for the Umatilla since 1992. Comparing the 1998 clearcut level to 1988, the Forest reduced the amount of acres by about 60 percent. The Forest has been reducing the amount of clearcut acres and continues to meet the Chief's policy.
Figure C-1
CLEARCUT ACRES
Umatilla National Forest
The trend has been complicated in recent years by salvage prescriptions in large fire areas and insect killed stands, since the silvicultural definitions for harvest methods often do not represent the mix of treatments done on the ground. Some of the salvage harvest areas appear to be clearcuts when completed, but do not meet the current forestry definitions for clearcuts. Therefore, harvest descriptions were used that most resemble the appearance of treatments occurring on the ground.
The long-term projection (based upon the current trend) indicates that the amount of clearcut acres will continue to decline. It is projected that the future timber sale program on the Umatilla NF will primarily focus on the issue of overstocked stands (middle structure or story) by implementing a commercial thinning program to bring stand densities in line with environmental conditions.
Recommended Action:
Silvicultural harvest methods continue to vary substantially from Forest Plan projections. The Forests expect differences to remain until the Forest Plans are adjusted, sometime after completion of the Interior Columbia Basin Ecosystem Management Project (ICBEMP).
MONITORING ITEM: Reforestation (top)
(Monitoring Items: Malheur 24/25, Umatilla 15, Wallowa-Whitman 8)
Questions: How many acres were reforested this year using natural and artificial regeneration practices? Are acres being satisfactorily restocked within 5 years of final harvest, per NFMA?
Table C-8 shows acres of reforestation accomplished by treatment method as compared to assumptions made in the Forest Plans.
Table C-8
REFORESTATION ACCOMPLISHMENT (IN ACRES) FOR FY 98
Malheur, Umatilla, and Wallowa-Whitman National Forests
MALHEUR |
UMATILLA |
WALLOWA- |
||||
Activity |
Forest Plan Avg/Year |
FY 98 |
Forest Plan |
FY 98 |
Forest Plan |
FY 98 |
| Site Prep for Natural Regeneration |
7,212 |
465 |
Not |
2,321 |
1,700 |
500 |
| Natural Regeneration without Site Prep |
0 |
59 |
3,100* |
4,482 |
8,000 |
2,084 |
| Artificial Regeneration (Planting) | 5,460 |
10,427 |
4,400 |
5,767 |
4,800 |
3,052 |
| * The Umatilla NF Forest Plan does not differentiate between natural regeneration categories (with and without site preparation). |
First-year survival for planted seedlings on the three Forests was 81 percent for the Malheur for ponderosa pine, 94 percent for the Umatilla, and 78 percent for the Wallowa-Whitman.
On the Wallowa-Whitman NF, first-year survival in 1996 was 75 percent. The 1998 Plantation Survival and Growth Report shows third-year survival on the same units has dropped to 56 percent, a significant and cumulative effect of the prolonged hot and dry summers of both 1996 and 1998 growing seasons, as well as continued mortality from gophers, livestock and big game, vegetative competition, and seedling problems.
An area is stocked to a satisfactory level when trees per acre meet the minimum or greater standards defined in the silvicultural prescription. Units are to be satisfactorily restocked within 5 years of final harvest. Tables C-9, C-10, and C-11 show stocking status on acres harvested 5-7 years ago for each of the Forests.
Table C-9
STATUS OF REFORESTATION AFTER FINAL HARVEST
Malheur National Forest
Year |
Revised Final
Harvest Acres |
Adequately |
Not Adequately
|
Not Adequately
Stocked - |
|||
Acres |
% |
Acres |
% |
Acres |
% |
||
1991 |
14,100 |
13,978 |
99 |
122 |
1 |
0 |
0 |
1992 |
12,430 |
11,913 |
96 |
517 |
4 |
0 |
0 |
1993 |
9,221 |
8,491 |
92 |
730 |
8 |
0 |
0 |
| (Source: Annual Reforestation and Timber Stand Improvement Accomplishment Report, Table 22.) |
Table C-10
STATUS OF REFORESTATION AFTER FINAL HARVEST
Umatilla National Forest
Year |
Revised Final
Harvest Acres |
Adequately |
Not
Adequately |
Not Adequately
Stocked - No Further |
|||
Acres |
% |
Acres |
% |
Acres |
% |
||
1990 |
8,080 |
7,251 |
90 |
829 |
10 |
87 |
1 |
1991 |
9,754 |
9,176 |
94 |
578 |
6 |
22 |
<1 |
1992 |
10,368 |
8,619 |
83 |
1,749 |
17 |
0 |
NA |
1993 |
5,084 |
4,473 |
88 |
355 |
7 |
256 |
5 |
| (Source: Annual Reforestation and Timber Stand Improvement Accomplishment Report, Table 22.) |
Table C-11
STATUS OF REFORESTATION AFTER FINAL HARVEST
Wallowa-Whitman National Forest
Year |
Revised Final
Harvest Acres |
Adequately |
Not Adequately
|
Not Adequately
Stocked - No Further |
|||
Acres |
% |
Acres |
% |
Acres |
% |
||
1991 |
13,625 |
10,913 |
80 |
2,684 |
20 |
28 |
<1 |
1992 |
7,846 |
6,014 |
77 |
1,832 |
23 |
0 |
NA |
1993 |
4,695 |
3,573 |
76 |
1,122 |
24 |
0 |
NA |
| (Source: Annual Reforestation and Timber Stand Improvement Accomplishment Report, Table 22.) |
On the Wallowa-Whitman NF, many of the acres considered not adequately stocked are associated with wildfire areas of the mid to late 1980s. Many areas burned by wildfires, and then subsequently salvaged, were planted to grass seed as part of the planned rehabilitation efforts. The resultant thick sod of grass adversely affected the survival of planted seedlings. These areas may need up to 20 years to adequately restock themselves naturally. Since some of these areas would not have been harvested had the wildfires not occurred, the Forest Service cannot justify attempting to reforest them every year.
The following table displays natural and planted regeneration acres for the Umatilla NF during FY 98. For reporting purposes, natural regeneration includes the acres of site preparation for natural regeneration and acres of certified natural regeneration without site preparation (National and Regional procedures).
Table C-12
REFORESTATION ACCOMPLISHMENT ACRES -- FY 98
Umatilla National Forest
Activity |
Heppner |
NFJD |
Pomeroy |
Walla Walla |
Forest Total |
Forest Plan Ave./Yr. |
| Site Preparation for
Regeneration: Natural Artificial (planting/seeding) |
- |
63 |
- |
- |
63 |
Not Available* |
| Natural Regeneration Without Site Preparation | 76 |
3,291 |
173 |
942 |
4,482 |
3,100* |
| Artificial Regeneration (planting) | 1,808 |
2,973 |
611 |
375 |
5,767 |
4,400 |
| * The Umatilla Forest Plan does not differentiate between natural regeneration categories (with and without site preparation). |
For FY 98, both planting and natural regeneration acres exceeded Umatilla Forest Plan projections. The higher levels have resulted from reforestation of the large fires and recent insect mortality areas. First year survival is slightly above 1997 levels at 94 percent, while third-year survival dropped to 47 percent, the lowest level for the last 10 years. Additional information on the reforestation program is provided in the Umatilla NF Monitoring Item 15.
Survival and growth show how well the seedlings are doing during the first few years after planting or natural regeneration. Stocking levels provide a picture of how well harvested stands are becoming reforested to desired levels. Stocking exams are conducted yearly to determine if harvested acres are being fully stocked within 5 years after final harvest, a key requirement of NFMA for timber production areas. Information gathered from the surveys is also used by managers to determine if further treatments are needed. The following table displays the status of the Umatilla NF's reforestation after final harvest from 1990 through 1993.
The information provided in Table C-10 shows that since implementation of the Umatilla Forest Plan, between 83 and 94 percent of the timber harvest acres receiving a final harvest treatment (clearcutting, shelterwood, seed tree, or overstory removal; individual tree or group selection cut) were adequately stocked within the 5-year timeframe established by NFMA. Of the acres not adequately stocked (a total of 3,511 acres for the 4 years combined), it is anticipated that all acres can be adequately stocked after additional treatments (replanting, fill-in planting, etc.).
Recommended Actions:
The Umatilla NF needs to review the long-term reforestation survival on the Forest (see Umatilla Monitoring Item 15).
Assumptions regarding Forest Plan reforestation projections will probably be updated upon completion of the ICBEMP and initiation of Forest Plan adjustments. The Forests need to re-examine some of the assumptions in the Forest Plans related to total anticipated acres of reforestation through the remaining portion of the decade. With adoption of an ecosystem management approach, a new trend is toward less regeneration harvest and a resulting downward trend in reforestation.
MONITORING ITEM: Fire Managed for Resource Benefits (Prescribed Fire)
(top)
(Monitoring Items: Malheur 36, Umatilla 18, Wallowa-Whitman 10)
Questions: Are natural ignitions being utilized to allow fire to play its natural ecological role in wilderness areas? Are activity fuels being treated as predicted in the Forest Plan? Are non-activity fuels being treated on forested lands as envisioned by the Forest Plan?
On the Malheur National Forest, natural ignitions are not being utilized to allow fire to play its natural ecological role in forest ecosystems. The Forest has not updated the documents necessary to allow natural ignitions to burn.
Non-activity hazardous fuels on forested lands are being treated to reduce fire hazard, which leads to more cost-effective suppression.
Prescribed burning is being utilized to meet a variety of other management objectives as indicated in Table C-13.
Table C-13
DISTRICT ACRES BURNED BY MANAGEMENT OBJECTIVE
Malheur National Forest
| District |
Total Rx Acres |
Fuels Reduction Acres Burned |
Wildlife Acres Burned |
Silviculture Acres Burned |
| Bear Valley | 2,945 | 2,456 | 493 | 36 |
| Long Creek | 9,250 | 5,434 | 725 | 61 |
| Burns | 2,680 | 1,776 | 0 | 904 |
| Prairie City | 6,719 | 5,260 | 0 | 1,459 |
| Total | 21,594 | 14,926 | 1,218 | 2,460 |
As noted in other monitoring items, the Umatilla NF uses a variety of burning activities to accomplish resource and ecosystem management objectives, such as hazard reduction, site preparation, wildlife enhancement, and range improvement.
The Umatilla experienced 87 lightning fires in 1998; 14 occurred in wilderness. All were suppressed because the Forest does not have updated Fire Plans to allow use of fire as a management tool in these areas. Current Regional Office direction requires revision of past plans before natural ignition fires will be allowed to play a role in accomplishing management objectives. Updating these plans is not a priority for the Forest at this time.
Even if the Fire Plans had been updated, it is unlikely that all fires would have been considered to play a role in accomplishing management objectives. Other factors (chance of escape, lack of contingency resources, etc.) would have initiated suppression action. Human-caused fires would always be suppressed.
The Umatilla Forest Plan predicted an average annual treatment of activity fuels at 8,000 acres per year. In 1998, only 956 acres of activity fuels were treated using prescribed fire. The level of activity resulted from a decreased timber sale program and from adverse burning conditions, which reduced opportunities to treat fuels with fire in 1998.
Each ranger district reported that (non-activity) fuel treatments -- hazard reduction and/or wildlife habitat improvement burns -- were conducted during 1998. Only the Walla Walla Ranger District noted their success as shown in the following table.
Table C-14
PRESCRIBED FIRE USE AND RESULTS -- 1998
Walla Walla Ranger District - Umatilla National Forest
Objective |
Acres Treated |
Acres Meeting Objective |
Hazard Reduction |
600 |
500 |
Site Preparation |
388 |
388 |
Habitat Improvement |
1,000 |
600 |
Recommended Action:
Continue monitoring and reporting, and follow-up with reviews that test results against resource and ecosystem objectives.
MONITORING ITEM: Insects and Disease (top)
(Monitoring Items: Malheur 29, Umatilla 21, Wallowa-Whitman 3)
Questions: What are the current levels and trends of key insects and diseases on the Forests? Are destructive insects and diseases remaining below potentially damaging levels following management activities?
The annual aerial insect detection survey flights conducted cooperatively by the Pacific Northwest Region of the Forest Service and the States of Oregon and Washington provide data on the extent of insect infestations on all lands covered by the survey flights. Acres infested by key insects on National Forest lands and mapped during the 1998 survey flights are shown in Table C-15. Most forest diseases are not identified by aerial observers, so there is no annual tabulation of incidence or severity. Most data on Forest diseases comes from stand exams and personal observations by silviculture staff and pest management specialists. Risk Rating models can be used to estimate expected disease incidence based on more identifiable stand attributes.
Table C-15
FOREST SERVICE ACRES OBSERVED INFESTED BY KEY INSECTS IN 1998
(Aerial Insect Detection Survey)
Malheur, Umatilla, and Wallowa-Whitman National Forests
Key Insect |
Malheur |
Umatilla |
Wallowa-Whitman |
| Douglas-fir beetle | 1,013 |
2,602 |
3,627 |
| Spruce beetle | 0 |
0 |
765 |
| Fir engraver | 139 |
428 |
248 |
| Mountain pine beetle, lodgepole pine | 128 |
18 |
241 |
| Mountain pine beetle, ponderosa pine (PP) | 1,435 |
894 |
482 |
| Mountain pine beetle, western white pine | 0 |
0 |
0 |
| Mountain pine beetle, whitebark pine | 0 |
0 |
0 |
| Pine engraver | 135 |
101 |
6 |
| Western pine beetle | 533 |
89 |
19 |
| Western pine beetle, pole-size PP | 27 |
323 |
4 |
| Western spruce budworm | 0 |
0 |
0 |
| Tussock moth | 0 |
0 |
0 |
| Larch casebearer/larch needle cast | 1,927 |
731 |
4,711 |
| Note: Not all acres were equally infested by insects. |
Aerial survey data indicate that current population levels of most key insects in the Blue Mountains Province are relatively low. Douglas-fir beetles are increasing, especially in the Wallowa Mountains. Trees mapped in the survey faded in 1998, but were killed the year before. Informal observations indicate that even more trees were killed in 1998. An extreme wind event on July 2, 1998, resulted in scattered blowdown over a large area and near-complete blowdown over 300 acres of spruce and lodgepole type on the Malheur NF. Spruce beetle populations already exist in this area and there is potential for substantial population increase. Fir engraver levels that continue to remain high are sometimes associated with root diseases that have become more active in stands with budworm-weakened host trees.
Following the August 1996 Summit Fire on the Malheur NF, western pine beetle populations increased dramatically, and are currently in outbreak. Most of the large, reserved ponderosa pine that initially survived the fire were later killed by these beetles. Based on preliminary monitoring, the level of beetle damage that resulted was not expected. It is likely these trees were rendered susceptible to insect attack by heat damage to fine roots in the thick duff layer. Many decades of fire exclusion in ponderosa pine stands has often allowed an abnormally heavy accumulation of exfoliated bark scales and other fuels around the base of older trees. Long-duration heat, generated when this duff layer burns, often damages fine shallow roots, weakening the trees and rendering them susceptible to bark beetles.
Douglas-fir tussock moth pheromone trapping is used to monitor sub-outbreak population levels. Trap catches in 1998 increased dramatically over the previous year throughout the entire Blue Mountains Province. It is anticipated that some minor defoliation may occur in some areas in 1999. This situation will be closely monitored by larval sampling, cocoon sampling, and continued pheromone trapping.
For several previous years, population trends of most insects in the Blue Mountains has been downward, as indicated by the aerial survey. In 1998, most detectable damage did not change significantly from the previous year with the exception of the Douglas-fir beetle, which increased on all three Forests. As mentioned, Douglas-fir tussock moth is known to be on the increase, although defoliation is not yet visible. Larch casebearer has appeared in some areas in the last several seasons, causing only spotty, mostly light to moderate defoliation of some larches.
Insect and disease evaluations of projects indicate that management activities are not aggravating insects and diseases, and in fact may be reducing the susceptibility of stands to insects and diseases in many cases through stocking level control and increasing seral species component in treated stands. Most tree diseases increase with tree age and proportion of hosts in the stand. Since shade-tolerant species are susceptible to a high proportion of diseases, many managed stands are experiencing a gradual increase in disease activity. These same stands also increase in susceptibility or vulnerability to insects with time. The trend toward uneven-aged management could increase root disease, defoliators, bark beetles, and dwarf mistletoe above their historic levels.
Recommended Action:
Continue to monitor.
MONITORING ITEM: Allotment Management Planning (top)
(Monitoring Items: Malheur 19, Umatilla 38, Wallowa-Whitman
16)
Questions: Are Range analyses, AMP level NEPA decisions, and Allotment Management Plans (AMPs) being completed according to the Forest Plan schedule as revised by the 1995 Rescission Bill?
Forest Plans included schedules which emphasized allotment management planning on high priority allotments. The recent Rescission Bill (PL104-19) required the Forests to develop a new schedule to complete all AMP NEPA work within a 15-year timeframe. All three Forests are currently behind schedule.
Table C-16
STATUS OF RANGE AMPs AND EAs BY FOREST
Malheur, Umatilla, and Wallowa-Whitman National Forests
| Malheur | Umatilla | Wallowa-Whitman | |
| Number of Range Inventory and Analyses completed in FY 98 | None | None | None |
| Number of NEPA
decisions completed in FY 98 Number of allotments covered by these decisions |
None n/a |
None n/a |
None n/a |
| Number of AMPs
completed in FY 98 Number of allotments covered by these AMPs Cumulative number of AMPs that are Forest Plan sufficient |
2 2 9 |
4* 4 7 |
0 0 24 |
| Number of active allotments | 97 | 34 | 120 |
| Percent of active allotments with AMPs that are Forest Plan sufficient | 9% | 21% | 20% |
| * NEPA completed in previous years. |
Range program funding for the Wallowa-Whitman NF did not allow any new range inventory or NEPA decisions in 1998. A total of 22 allotments on the Wallowa-Whitman were in various stages of planning in FY 98. Ten allotments are included in the Upper Grande Ronde Range Planning Area (RPA) document which is near draft stage; three are in the Ghostbull RPA which is complete pending completion of ESA consultation; the remainder are in stages varying from completed field work to nearly-completed NEPA processes. In addition, work began near the end of FY 98 on two additional multi-allotment processes on the Lower Joseph RPA (11 allotments) and the South Burnt RPA (five allotments). These two efforts are anticipated to be completed to a draft document stage by the end of FY 99. When completed, these efforts should bring the Wallowa-Whitman NF on track with Rescission Act requirements.
The Umatilla NF completed four AMPs based on prior NEPA decisions. There was no funding for additional range inventory or NEPA planning efforts in FY 98 nor was any received to begin work for FY 99. Multi-allotment project proposals are being developed for FY 2000 which, if funded, would bring the Umatilla substantially on track.
Funding on the Malheur NF did not allow any new range inventory or NEPA decisions in 1998. The two AMPs completed were holdovers from NEPA done in previous years. Two other allotments are in the NEPA process but were not completed in FY 98. Work was started at the end of FY 98 for a multi- allotment NEPA process for a group of eight allotments in the Middle Fork John Day RPA. It is planned to have a draft EIS for public review by the end of FY 99. These efforts will still leave the Malheur behind Recission Act requirements, but additional planning efforts scheduled for FY's 2000 and 2001 should put the Forest near its needs.
Although progress has been made in analysis and planning, significant changes in program emphasis, including ESA consultation efforts, combined with extreme reductions in funding continue to cause overall accomplishments to remain low. The threshold of variability was exceeded on the three Forests but current efforts should allow all three Forests to be on track with Rescission Act requirements within a few years.
Recommended Actions:
Continue updating the Allotment Management Planning schedule, based on actual budgets and accomplishments to meet the requirements of the Rescission Act.
Continue pursuing adequate funding to accomplish allotment management planning in a timely manner.
Continue implementing the Tri-Forest process for multiple allotments analysis, providing greater efficiencies and accomplishments.
MONITORING ITEM: Timber Offered for Sale (top)
(Monitoring Items: Malheur 27, Umatilla 43, Wallowa-Whitman
4)
Questions: Are the Forests offering the ASQ and TPSQ estimated in the Forest Plans? Of the offered volume in the fiscal year, how much was actually awarded? How many sales and how much volume received no bids, and what were the reasons given for no bids?
In 1998, on the Malheur National Forest, all sales received bids and were awarded, although some were not awarded until FY 99.
Table C-17
TIMBER VOLUME OFFERED - FY 91-98
Malheur National Forest
VOLUME OFFERED FOR SALE |
||||
MMBF |
MMCF |
|||
| FISCAL YEAR | ASQ |
TPSQ |
ASQ |
TPSQ |
1991 |
NA |
202 |
NA |
39 |
1992 |
NA |
102 |
NA |
20 |
1993 |
66 |
72 |
13 |
14 |
1994 |
26 |
33 |
5 |
6 |
1995 |
65 |
67 |
13 |
13 |
1996 |
80 |
81 |
15 |
16 |
1997 |
38 |
39 |
7 |
8 |
1998 |
77 |
77 |
15 |
15 |
| Forest Plan Projected Output |
200 |
211 |
35 |
38 |
On the Umatilla NF, the amount of timber offered for sale remains below Forest Plan projections. About 39 percent of TSPQ and 31 percent of the ASQ were offered for bid in FY 98. All sales received bids and all offered volume was awarded. Table C-18 shows the timber offered for sale for FY 98.
Table C-18
TIMBER VOLUME OFFERED - FY 94-98
Umatilla National Forest
VOLUME OFFERED FOR SALE |
||||
MMBF |
MMCF |
|||
FISCAL YEAR |
ASQ |
TPSQ |
ASQ |
TPSQ |
1994 |
1 |
9 |
<1 |
2 |
1995 |
5 |
22 |
1 |
4 |
1996 |
19 |
45 |
4 |
8 |
1997 |
37 |
82 |
7 |
15 |
1998 |
38 |
62 |
7 |
12 |
Forest Plan |
124 |
159 |
22 |
28 |
During FY 98, timber offered for sale consisted mostly of salvage volume. The Forest still has some salvage potential from large-scale insect damage and mortality of the early 1990s. Salvage efforts continue on several large fires that burned in 1996. Timber killed in the Tower, Bull, and Summit fires on the North Fork John Day Ranger District is expected to be sold or resold in FY 99.
Table C-19
TIMBER VOLUME OFFERED - FY 91-98
Wallowa-Whitman National Forest
VOLUME OFFERED FOR SALE |
||||
MMBF |
MMCF |
|||
| FISCAL YEAR | ASQ |
TPSQ |
ASQ |
TPSQ |
1991 |
33 |
53 |
||
1992 |
66 |
79 |
||
1993 |
8 |
23 |
Not available |
|
1994 |
17 |
29 |
for this report |
|
1995 |
39 |
54 |
||
1996 |
44 |
53 |
86 |
103 |
1997 |
40 |
49 |
79 |
97 |
1998 |
32 |
40 |
62 |
78 |
| Forest Plan Projected Output |
141 |
205 |
` |
|
The Wallowa-Whitman National Forest had a target of 52,800 mbf for all products in FY 98; 40,332 mbf was offered. All sales offered were awarded. Three sales which were not offered account for the shortfall in the target. Two sales were delayed due to consultation requirements of the Endangered Species Act. A third sale received an appeal. The Forest withdrew the Decision Notice for this sale. After conducting additional analysis, a new Decision Notice was issued and the sale is being offered in FY 99.
On all the Forests since FY 93, the annual volume targets assigned by the Regional Office have been considerably less than Forest Plans TPSQs and ASQs. Forests' output levels have been based on estimated amounts which each has determined they can produce under the newer standards of PACFISH, INFISH, and Regional Forester's Amendment 2.
Recommended Actions:
Adjust Forest Plan ASQ and TPSQ levels upon completion of the ICBEMP.
Continue to update vegetation data and other relevant information in preparation for Forest Plan adjustment.
MONITORING ITEM: Socio-Economics (top)
(Monitoring Items: Malheur 37-41, Umatilla 54-59, Wallow-Whitman 45-47)
The coordinated socio-economic monitoring items are not addressed this year. A brief status of available information is described below.
Annual Programs and Budgets
The Forest Service is currently developing and implementing a new budget process (FFIS); Region 6 is a test region. Currently, the budget and program data and information for FY 98 are not readily available and not expected to be available for some time. Reporting on this monitoring item therefore has been delayed.
Costs and Values
Information for this item is also, in part, derived from information based on the new budget process. In addition, RPA non-market values are currently under review and development by the Washington Office. No date has been given for the release of the RPA data (a component of this monitoring item).
Payments to Counties
Payments to Counties information has been released to the public in news releases and articles. Payments continue to be significantly less than Forest Plan projections.
Employment and Income
Information related to this item was extensively reviewed and described in the "Economic and Social Conditions of Communities" released by ICBEMP in February 1998. The Employment Specialization by Industry Category was determined for nine communities in Grant County, two in Harney County, 12 in Umatilla County, eight in Union County, four in Wallowa County, and three in Wheeler County, which represents almost half the communities in the impact zone for the Blue Mountains. Based on reduced harvest levels from the Forest Plans, expected timber jobs and income continue to be approximately 50-80 percent out of the range of projections.
Recommended Action:
Continue monitoring and report FY 98 results in next year's report.
SPECIAL FOCUS ITEM: Prescribed Fire Monitoring (top)
Background
The prescribed fire program in the Blue Mountains has significantly increased in the past few years, from 29,155 acres for the three Blue Mountain Forests in 1992 to 62,939 acres in 1998. Burning is being done to meet a variety of objectives, including fuels reduction, forage improvement, noxious weed control, wildlife habitat improvement, and stocking control.
Because the prescribed fire program was expected to continue to increase in the immediate future, the Forest Supervisors of the three Blue Mountain Forests decided to have 1998 Tri-Forest monitoring reviews focus on the prescribed burning program. In particular, field reviews were to focus on management-ignited fires conducted for reasons other than reduction of activity (e.g., timber sale) fuels.
In addition, Region 6 (Pacific Northwest Region) of the Forest Service is currently operating under two interim aquatic management strategies: PACFISH, for stream systems providing habitat for anadromous fish species; and INFISH, for stream systems providing habitat only for resident fish. The Blue Mountain Forests felt that prescribed fire reviews would also provide an opportunity to monitor implementation of PACFISH and INFISH standards.
Project Selection and Monitoring Process
Prescribed fires were randomly selected for review from a list of prescribed fires completed from 1995 through the fall of 1997. In cases of extremely small or isolated fires, or where a prescribed fire had already received extensive on-Forest review, minor adjustments were made to the sampling strategy. Sixteen prescribed fires were selected for review; an additional four fires were reviewed at a Monitoring Team's discretion when they were out in the woods. The prescribed fires reviewed by Tri-Forest Monitoring Teams are shown in Tables C-20 and C-21.
Table C-20
BREAKDOWN OF PRESCRIBED FIRES* BY FOREST
1995 to Fall 1997
Blue Mountain National Forests
MALHEUR |
UMATILLA |
WALLOWA- |
||||
PACFISH |
INFISH |
PACFISH |
INFISH |
PACFISH |
INFISH |
|
| Total number of prescribed fires 1995-1997 | 11 |
26 |
20 |
0 |
9 |
2 |
| Number of prescribed fires monitored by Tri-Forest Interdisciplinary Teams |
2 |
11 |
4 |
0 |
2 |
1 |
| * Not including prescribed natural fires or treatment of activity fuels. |
Table C-21
PRESCRIBED FIRES MONITORED BY TRI-FOREST TEAMS IN 1998
Blue Mountain National Forests
| PRESCRIBED FIRE | FOREST |
DISTRICT |
PACFISH or INFISH |
FALL OR SPRING BURN |
APPROX. ACRES |
| Joaquin 01 | Malheur | Burns | INFISH |
spring |
245 |
| Poison 01 | Malheur | Burns | INFISH |
combination |
26 |
| Lonesome 01 | Malheur | Burns | PACFISH |
spring |
1,250 |
| Windfall Aspen | Malheur | Bear Valley | INFISH |
combination |
5 |
| Antelope 2 * | Malheur | Bear Valley | INFISH |
spring |
1,205 |
| Antelope 3 | Malheur | Bear Valley | INFISH |
combination |
655 |
| Antelope 4 * | Malheur | Bear Valley | INFISH |
combination |
785 |
| Antelope 7 | Malheur | Bear Valley | INFISH |
spring |
1,005 |
| Antelope 8 * | Malheur | Bear Valley | INFISH |
spring |
600 |
| Vinegar | Malheur | Long Creek | PACFISH |
spring |
3,170 |
| Awake 02 | Malheur | Prairie City | INFISH |
spring |
649 |
| Awake 04 | Malheur | Prairie City | INFISH |
spring |
721 |
| Awake 08 * | Malheur | Prairie City | INFISH |
fall |
464 |
| Oriental Juniper 1 | Umatilla | North Fork John Day | PACFISH |
combination |
2,470 |
| Oriental Juniper 2 | Umatilla | North Fork John Day | PACFISH |
fall |
2,545 |
| Camp Creek | Umatilla | Walla Walla | PACFISH |
fall |
2,000 |
| Pasture | Umatilla | Pomeroy | PACFISH |
fall |
1,000 |
| Spring Creek 501 | W-W | La Grande | PACFISH |
fall |
460 |
| BMEI #6 | W-W | La Grande | PACFISH |
fall |
200 |
| Lower Montane C | W-W | Baker | INFISH |
spring |
505 |
| * Not selected as part of random sample. Reviewed at Monitoring Team's discretion. |
Monitoring Teams consisted of six to nine Forest Service employees, with at least one representative from each Blue Mountain Forest. Most teams included a wildlife biologist, silviculturist, fire/fuels specialist, and either a hydrologist or soils scientist. The larger teams included other resource specialists, such as fish biologists, archaeologists, line officers, or landscape architects. Both District and Forest-level people participated on these teams. The Teams also included one to three National Forest stakeholders, including private citizens, timber industry representatives, cooperators, environmental groups, and local elected officials.
The Monitoring Teams focused on the following questions given them by the Forest Supervisors and Forest Planners:
� Was the NEPA planning done in an interdisciplinary manner?
� Were project goals and objectives appropriate? Were they met?
� What kind of ecological effects were observed (e.g., erosion, snag levels, stand structure, etc.)?
� Were mitigation and design features implemented as described in the NEPA document?
� Were appropriate procedures followed in planning and reporting air quality?
� Were any conflicts perceived between the Forest Plan assumptions and the Desired Future Condition?
Summary of Findings
While each prescribed fire had its own unique issues and findings, certain themes recurred across a number of fires. These are summarized in individual subsections below, along with the Monitoring Team's major recommendations. Detailed information on each individual review may be obtained from the Malheur National Forest Headquarters in John Day, Oregon.
While the following discussions indicate that documentation of the burning program could be improved, the Monitoring Teams were generally pleased with the results on the ground. The people involved with implementation demonstrated a high level of professionalism and expertise, and were aware of resource objectives even if those objectives were not explicitly documented.
NEPA Planning
Most of the prescribed fire NEPA efforts appeared to be more multi-disciplinary than interdisciplinary. Purpose and Need statements were very broad, and frequently did not provide a common vision of what was desired on the ground, particularly in relation to vegetative effects. Design features and mitigation measures were not always coordinated among the resources, occasionally resulting in conflicting direction for the project. In some cases, Monitoring Team members were left with the impression that prescribed burning was done simply to meet burning targets rather than to achieve desired conditions.
Many of the effects analyses were quite weak, with only cursory discussion of the expected effects of the project. This may be due to a variety of reasons, including other priorities, perception of limited risk, lack of fire funding for detailed analysis, limited line officer (Deciding Official) involvement, and the perceived "white hat" nature of the role of fire in the ecosystem.
Ties to higher-order plans, such as PACFISH, INFISH, and the Region 6 EIS for Competing and Unwanted Vegetation, were sometimes not clear. For example, some fire prescriptions prohibited fire ignition in riparian areas, but fire was allowed to back into these areas. While this resulted in no observable detrimental impacts to riparian areas, the analyses did not address how this prescription would "contribute to the attainment of the Riparian Management Objectives" per PACFISH and INFISH. Similarly, because almost all the prescribed fires had multiple objectives in addition to fuels reduction, the prevention of competing and unwanted vegetation should have been addressed per the Region 6 EIS.
While most prescribed fire projects were documented in Decision Memos rather than EAs, a few were part of larger multiple-project restoration EAs. Even in the EAs, discussion of the issues, alternatives, and effects of large-scale prescribed burning were generally limited, with most of the documentation centered around other elements of the restoration project, usually a timber sale.
With a few notable exceptions, little formal monitoring has been done of any of the prescribed fires, although a number of ranger districts indicated they are developing prescribed fire monitoring strategies this year. Most fires received some level of informal walk-through monitoring, although results were not always documented in project files.
Although the NEPA analyses for most the prescribed fire projects was weak, the Monitoring Teams recognized that they were reviewing some of the districts' earliest efforts at prescribed fire analysis, not the current efforts. The results discussed above are based on NEPA documents that were generally 2 to 5 years old, and improvements may have been made since that time.
Recommendations:
Emphasize use of interdisciplinary Watershed Analyses or Integrated Resource Analyses to identify the Desired Future Conditions and Purpose and Need for prescribed fire in a given landscape.
Increase line officer (Deciding Official) involvement with the NEPA process, particularly at key points of the analysis process such as identification of Purpose and Need, Issues, and Range of Alternatives (per Forest Service Manual direction). Line officers should also emphasize the need for interdisciplinary rather than multi-disciplinary analyses and review.
Improve documentation of compliance with higher-order plans, particularly PACFISH, INFISH, and the Region 6 EIS for Competing and Unwanted Vegetation.
Provide direction for a consistent level of analysis across the Blue Mountain Forests (Forest Planners to take the lead with assistance of the Fire Planners). As identified on the field trips, there is a need for consistent direction relating to:
* How/whether to address multiple burning entries in a single NEPA document.
* When it is appropriate to document prescribed burning in a Categorical
Exclusion rather than an EA, particularly in regards to size (acreage) and
Federally listed species.
Conduct additional monitoring using measurable protocols and report the results.
Project Goals and Objectives
In many cases, objectives stated in the Burn Plans were general and not measurable, such as "improve forage" or "improve forest health." Because Burn Plans are essentially the implementation documents for the projects, more site-specific objectives would be appropriate, such as "improve grass forage in Unit 11 by 20 percent" or "improve forest health by reducing stocking of seedlings and saplings in Units 11 and 12 by 30-50 percent."
Other Burn Plans were largely boilerplate, with a single set of objectives and burning prescriptions developed for an entire ranger district or zone. These, too, lacked site specificity, and were often extremely broad so as to encompass all possible conditions that might be encountered in a large area. This is not conducive to achieving specific results on a given area.
Objectives, design features, and mitigation measures in the EAs did not always track through into the Burn Plans. EA requirements were frequently omitted and sometimes changed in the Burn Plans.
The lack of site-specific information in the Burn Plans would make it difficult to implement for those not involved with the planning process. However, the fire people implementing these projects had a good understanding of the concerns and expectations for each area, even when the site-specific objectives were not documented, and did a professional job at applying fire on the ground.
With the broad objectives and little measurable monitoring, it was not always clear whether objectives were met, particularly fuels reduction and forage enhancement. The fires generally burned fairly cool, and fuel and duff reduction objectives were sometimes not met with the initial burn entry. It was not always clear in the NEPA documents and Burn Plans whether multiple burns were expected to be necessary in order to meet objectives.
Recommendations:
Ensure there is a clear tie between the Purpose and Need in the EA and the site-specific objectives in the Burn Plans. Ensure concerns, design features, and mitigation measures are tracked and documented.
Where appropriate, identify a range of acceptable results rather than just a maximum or minimum. For example, if an objective is fuels reduction, say "reduce duff 30-50 percent" (which ensures SOME duff reduction) rather than saying "reduce duff no more than 50 percent" (which means even 1 percent is acceptable).
Improve site specificity of Burn Plans so that someone unfamiliar with the project could read the plan and know the site-specific objectives and mitigations for a given burn area. For example, rather than a generic "protect archaeological sites" for the area, specify "protect archaeological site in NE corner of burn unit 11 near road 419."
Identify whether objectives in Burn Plans are for the initial prescribed fire entry (short term) or the end result of multiple prescribed fire treatments (long term).
The ranger districts showed a wide range of burning costs. Capitalize on lessons from other units on cost reduction where possible.
Many of the projects were done in cooperation with adjacent landowners or partnerships with other interested stakeholders. The districts are to be commended for this outreach effort. (Note: if burning private land with National Forest land, this should be disclosed in the cumulative effects analysis.)
Implementation of Project Design and Mitigation Measures
As noted earlier, occasional problems were noted with tracking design features and mitigation measures from the EA to the Burn Plans. In some cases, this resulted in conflicting direction (e.g., the EA said to kill no more than 10 percent of the understory, the Burn Plan said no more than
20 percent of the understory). More common was the omission of EA design and mitigation measures from Burn Plans.
As discussed under NEPA and Project Objectives, identification of design and mitigation measures should have been more site specific, to ensure that people unfamiliar with a project could implement it if necessary.
Recommendations:
In addition to some of those already listed under NEPA and Objectives, address Burn Plans at the next Tri-Forest Fire Management Officer meeting, to improve tracking and documentation before a failure in the system occurs.
Where the Burn Plan is essentially the Implementation Plan for the entire project, it should include responsibilities (who/when/etc.) for implementation and monitoring. When burning is part of a large restoration plan with a variety of projects, a separate implementation plan is needed to address all aspects of the project.
Ecological Effects
Because most of the prescribed fires burned at low intensity, effects were mostly neutral to slightly positive. Fuel loading was reduced and forage appeared to increase, although not always to the levels prescribed in the Burn Plans. Tree mortality was limited except in units were stocking level reduction was an objective of the treatment. On two of the Malheur units, however, stocking levels were not reduced enough to meet that objective. A plantation on the Wallow-Whitman suffered excess mortality when winds shifted during the ignition of the unit. None of the burning resulted in significant increases in bark beetles, although in some fire units it was too soon to tell. Snags and down woody material were minimally impacted.
Where fire was allowed to back into riparian areas, no adverse effects were observed. Soil impacts were generally neutral except for a few small, localized areas that were severely burned, resulting in some pedestaling and erosion. These occurrences were minor, well within Forest Plan standards, and sediment did not appear to be reaching any streams.
Overall, the ranger districts showed good understanding of, and sensitivity to, resource values. Most of the sale units appeared to be appropriately implemented; however, there is still room for improvement. An example would be Riparian Habitat Conservation Areas (RHCAs) where objectives and prescriptions were not clearly defined.
Recommendations:
Develop a formal monitoring study of prescribed fire effects on large-diameter ponderosa pine. There is concern that delayed mortality will result from burning heavy duff around these trees, as surface root mortality was observed on one of the Bear Valley Units.
Stratify the sampling strategy the next time prescribed fires are monitored to include the full range of forest types where we will use burning as a tool.
The Forests need to address the emerging issue of noxious weeds and how it relates to the use of prescribed fire.
Tracking and Reporting Air Quality (Smoke Emissions)
All ranger districts appeared to meet the reporting procedures regulated by the Memorandum of Understanding with the states. Some districts appeared to have over-reported the tons consumed, reporting total acres rather than blackened acres to the State, but this situation has since been corrected.
Forest Plan Questions and Potential Conflicts
The Monitoring Teams identified a number of prescribed fire issues that they felt should be addressed during the next round of Forest planning:
� Are current standards for snags, down woody material, and big-game cover ecologically sustainable in drier pine sites if fire is to be kept as part of the ecosystem?
� Areas or stands with prescribed fire mortality may need to be replanted in order to meet requirements of the National Forest Management Act if they fall below the minimum stocking level.
� How does the historic fire regime fit the Desired Future Condition?
� The current Forest Plan standards and goals view prescribed fire primarily at the stand level. The next round of Forest planning should address prescribed burning at a landscape level.
� The prescribed fire program should be monitored again in 2 to 3 years to determine whether improvements have been made in analysis and documentation, and to observe the ecological effects on the ground.