 |
NASA
SENSORS FIND POLLUTION HIDING IN THE SHADOZ
|
|
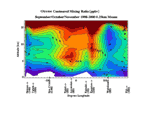
| | | Image
1 | | |
NASA
and scientists from 10 tropical countries have used balloon-borne sensors to obtain
the first picture of the structure of ozone (pollution) in the tropical troposphere,
the atmospheric layer between the surface and 50,000 feet. Under the SHADOZ (Southern
Hemisphere Additional Ozonesondes) Project, they have found that ozone "piles
up" over the south Atlantic Ocean due to natural circulation patterns and
that pollution (low-level ozone) from Africa and South America streams into the
pile-up region, making the ozone even thicker. "To
envision how the pollution is moving, think of the Atlantic Ocean as having a
horizontal wheel on either side, pushing pollution into the middle, where atmospheric
motions are already dumping ozone. Both pollution and the pileup are strongest
between August and November," said lead researcher Anne Thompson of NASA's
Goddard Space Flight Center in Greenbelt, Maryland. Over the Pacific and Indian
Oceans, the ozone shifts locations with the waxing and waning of El Niño
cycles. El Niños shift wind circulation patterns, decreasing the ozone
over the eastern Pacific, and increasing it over the Indian Ocean. The
new ozone data has come from a 5-year scientific effort in which NASA has partnered
with NOAA, Japanese, Indonesian and Brazilian space scientists and with researchers
in Kenya, South Africa, Java, South Africa, Suriname and four Pacific islands.
Since 1998 more than 1,500 balloons bearing ozone sensors called ozonesondes have
been launched over these tropical locations. The data are stored in a web-based
location designated as the SHADOZ project and are publicly available. "Before
SHADOZ, ozonesonde launches would stop and start and the data were not easy to
get," said Jacquelyn Witte, co-researcher on the project. By providing additional
sensors to the partners, all the data are collected, shared and distributed worldwide.
With
more ozone over the Atlantic than the Pacific, the additional ozone pileup is
called a "wave-one pattern" that is seen by satellite. The ozonesondes
help see what the satellites do not, and it looks as if the wave one pattern is
predominantly if not exclusively in the troposphere. Thompson said, "This
solves a decade-old mystery about where the Atlantic ozone was coming from."
The
SHADOZ project has also been very important to people interested in tropical climate
and meteorology, and those scientists that work on improving satellite sensors.
The ozone data also show that the tropical tropopause - the border between stratosphere
and troposphere - is a 2-mile thick transition layer, not a sharp boundary as
scientists previously thought. Prior to SHADOZ, satellites were the only way to
get this information, and there was no way to verify it. SHADOZ data will be used
to improve satellite instruments by comparing their readings to those taken from
the ground up. Thompson
will present her findings in Session A52B-03, "Variability in Ozone in the
Tropical Tropopause Region from the 1998-2000 SHADOZ Data," at the American
Geophysical Union 2002 Spring Meeting in Washington, D.C., on Friday, May 31,
2002, at 1:30 p.m., at the Washington Convention Center in Room: WCC Hall D. Back
to Top |


