|

| Home | Deposit Insurance | Consumer Protection | Industry Analysis | Regulations & Examinations | Asset Sales | News & Events | About FDIC |
|
|||||||||||||||||||||||||||||||||||
|
Home > Industry Analysis > Research & Analysis > Working Paper Series > Bank Loan Underwriting Practices: Can Examiners’ Risk Assessments Contribute to Early-Warning Systems? |
|||
|
Bank Loan Underwriting Practices: Can Examiners’ Risk Assessments Contribute to Early-Warning Systems? |
||
|
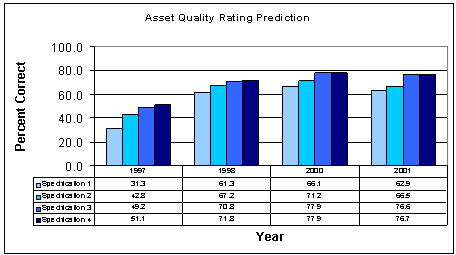
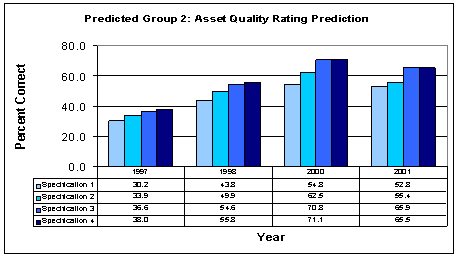
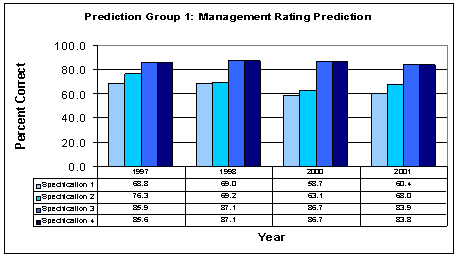
Working Paper 2003-06 November 2003 * John O’Keefe is Chief of the Financial Risk Measurement Section, Division of Insurance and Research, FDIC. Virginia Olin is a Senior Financial Economist, Division of Insurance and Research, FDIC. Christopher A. Richardson is an Economist with the Center for Responsible Lending, Washington, DC and was at the U.S. Department of Justice, Civil Rights Division when this paper was written. The authors thank Andrew Davenport and Michael Jenkins of the FDIC and the participants in the 2003 annual meetings of the Western Economic Association, for helpful comments and suggestions. The views expressed here are those of the authors and not necessarily those of the Federal Deposit Insurance Corporation or the Department of Justice. Absract Loan underwriting practices are the primary determinant of bank credit risk and bank credit availability. For this reason, U.S. bank supervisors conduct periodic surveys to assess bank underwriting practices and their riskiness. In early 1995 the Federal Deposit Insurance Corporation (FDIC) introduced a comprehensive examination questionnaire, or survey, of bank underwriting practices at FDIC-supervised banks; FDIC bank examiners complete the survey at the end of each FDIC-supervised bank examination. The survey covers lending practices both in general and in specific loan categories. This study investigates (1) the relationships between examiners’ assessments of the riskiness of bankers' lending practices and subsequent changes in bank condition, and (2) the question of whether these relationships can enhance supervisors’ early-warning systems. We find that higher (lower) risk in underwriting practices is associated with subsequent increases (decreases) in nonperforming assets generally. We also find that assessments of underwriting risk contribute to off-site surveillance models that predict safety-and-soundness examination ratings. However, this contribution is largely subsumed by that of concurrent safety-and-soundness examinations ratings. Thus, underwriting survey data are best used as diagnostic measures of the sources of financial distress. 1. Supervisory Tools for Monitoring Bank Loan-Underwriting Practices To maintain public confidence in insured depository institutions and to protect the deposit insurance funds (the Bank Insurance Fund and the Savings Association Insurance Fund), federal regulatory agencies must promote the safety and soundness of commercial banks and savings associations. To a great extent, the risk to an institution's soundness and to the insurance funds is determined by the quality of the institution's loan portfolio. Loans typically make up the largest portion of the institution's asset structure, and they ordinarily present the greatest credit risk and therefore the greatest potential loss exposure to banks. The most common supervisory tools used by the regulatory agencies in promoting safety and soundness are on-site examinations and off-site surveillance systems. Each serves a unique purpose. For the on-site examination, the objective is to evaluate effectively the safety and soundness of the FDIC-insured depository institution (hereinafter "bank") and to analyze all aspects of the bank’s operations, including loan portfolios and policies on making sound loans. For off-site surveillance systems, the objective is to provide bank supervisors with an early warning of potential problems in banks’ condition. Some off-site systems model financial data that banks file with regulators (the modeling is to determine whether additional supervisory attention is warranted before the next regularly scheduled on-site examination; examination frequency is discussed below in the section on sample and data). Other off-site systems use different indicators to predict changes in banks’ condition. In early 1995 the FDIC introduced a third tool, a hybrid of on-site examinations and off-site surveillance systems: a questionnaire, or survey, that supplements on-site examinations. Because loan underwriting practices are the primary determinant of a bank’s credit risk and credit availability, the survey’s focus was on current underwriting practices. The survey is intended to provide an early warning of potential credit-quality problems. When examiners look at credit administration during the examination, they identify weaknesses that may exist, and they note that if these practices are not improved, the bank’s condition will probably worsen because of deterioration in the quality of loans. On the basis of this review, they complete the survey. Thus, the underwriting survey is a way to anticipate future problems by relying on examiners’ risk assessments of current underwriting practices. In this study we assess the survey’s contribution to early-warning systems by examining the predictive content of survey data, using two models: one forecasts changes in banks’ supervisory ratings, and the other forecasts banks’ nonperforming assets. In the rest of this section, we briefly explain on-site examinations, off-site surveillance systems, and the FDIC supplemental questionnaire. In the next section we discuss three areas of related empirical research: underwriting cycles in property and casualty insurance markets, bank supervisors’ off-site surveillance systems, and the predictive content of bank supervisors’ surveys of underwriting practices. Then we describe our sample and data. After that we present the methodology used to examine the potential contribution of the FDIC underwriting survey to early-warning models, and the results of our empirical tests. Finally, we summarize and conclude. 1.1 On-Site Examinations There are four fundamental reasons for on-site examinations. First, they help maintain public confidence in the integrity of the banking system and individual banks. The existence of unhealthy or deteriorating conditions, which may threaten this integrity, should be disclosed through the examiners’ evaluations. Second, periodic on-site examinations provide the best means of determining banks’ adherence to laws and regulations. Third, the examination process can help prevent problem situations from remaining uncorrected and deteriorating to the point at which costly financial assistance by the FDIC becomes unavoidable. Finally, examinations supply supervisors with an understanding of the nature, relative seriousness, and ultimate cause of a bank’s problems and thus provide a sound factual foundation on which to base corrective measures, recommendations, and instructions. The appraisal of lending and collection policies and of the bank’s adherence to those policies, as well as the evaluation of individual loans, is only part of the on-site examination. To be sure, examiners are instructed to review loan policies and portfolios, but they are also capturing a kind of information different from that captured in off-site surveillance systems. Specifically, they review lending policies to ensure that the policies are clearly defined and explicit enough to provide the directors and senior officers with effective supervision. They check to see that loan policies are up-to-date and have been approved by the board of directors. And they check to see that the actions taken by officers and employees adhere to established policies. The examiners’ manual contains an extensive list of broad areas of consideration and concern that lending policies should address. [1] At the end of each on-site examination, the bank is assigned a safety-and-soundness rating. The basis for this rating is the Uniform Financial Institutions Rating System (UFIRS) designed to evaluate banks’ condition on a uniform basis and to identify banks requiring special attention or concern. Each examined bank is assigned a composite rating that uses six essential components of the bank's financial condition and operations. These components address the adequacy of capital (C), the quality of assets (A), the capability of management (M), the quality and level of earnings (E), the adequacy of liquidity (L), and the sensitivity to market risk (S). Hence, the composite rating is called a CAMELS rating. Composite and component ratings are assigned on a 1 to 5 numerical scale. A "1" indicates the highest rating (strongest performance and risk management practices, and the least degree of supervisory concern), while a "5" indicates the lowest rating (weakest performance, inadequate risk management practices, and therefore the highest degree of supervisory concern). In sum, on-site examinations are the best way for supervisors to track the condition of banks; however, since examiners cannot be continuously on-site, regulators also use off-site surveillance to help span the gap between regularly scheduled on-site examinations. 1.2 Off-Site Surveillance Off-site surveillance provides supervisors with an early warning of potential problems in the bank’s condition. Some off-site systems use statistical techniques that analyze previous financial data that banks file with regulators (Call Reports) to predict future CAMELS composite and component ratings. Other systems are not statistically based, but they still have predictive qualities. Both kinds of systems provide information that helps regulators determine whether additional supervisory attention is warranted before the next regularly scheduled on-site examination. Use of off-site surveillance, however, is not a substitute for periodic on-site examinations. Instead, it is a valuable complement to the examination process. Off-site surveillance has several advantages. For instance, it is far less intrusive and uses fewer personnel than on-site examinations. And since off-site surveillance can identify banks that show signs of financial distress, it also helps regulators allocate on-site examination resources efficiently. 1.3 The FDIC Supplemental Questionnaire The supplemental questionnaire, or survey, introduced in 1995 asks examiners to respond to questions only about underwriting practices. Underwriting practices can generally be characterized by the criteria used to qualify borrowers, loan pricing, repayment terms, sources of repayment, and collateral requirements. Underwriting practices also encompass the management and administration of the loan portfolio, including its growth, concentrations in specific markets, out-of-area lending, and adherence to written underwriting policies. [2] FDIC bank examiners complete the survey at the end of each FDIC-supervised bank examination. They assess material changes in underwriting practices and evaluate them in relation to supervisory standards, rating the risk associated with a bank’s underwriting practices in absolute terms: low, medium, or high. [3] FDIC examiners also classify the frequency of specific risky underwriting practices for overall lending as "never or infrequently," "frequently enough to warrant notice," or "commonly or as standard procedure." [4] Specifically, the FDIC survey asks examiners about the risk in current underwriting practices, loan portfolios, purchased loan participations, loan growth and/or significant changes in lending activities, and loan administration. In addition, examiners rate the frequency of the following risky practices in overall lending: lending in amounts that result in concentrations to one industry or borrower, out-of-area lending, failing to adjust loan pricing for risk, failing to require principal reductions before renewing loans terms, and deviating from written lending policies. Finally, examiners classify the frequency of specific risky underwriting practices in seven major loan categories: business, residential and commercial (nonresidential) real estate construction, commercial real estate, home equity, agriculture, consumer, and credit cards. [5] The designers of the first survey were staff from the FDIC’s former Division of Research and Statistics and Division of Supervision (now the Division of Insurance and Research and the Division of Supervision and Consumer Affairs, respectively). Before selecting the questions, the designers reviewed the underwriting practices of banks that had failed during the banking crisis of the 1980s. [6] Once questions were chosen, test surveys were sent to FDIC examiners and Division of Supervision regional directors for comment and feedback. Although some of the survey questions have changed over time to account for emerging underwriting concerns and to incorporate feedback from examiners, the majority of questions have remained intact. Other U.S. bank regulators also conduct underwriting surveys; however, the FDIC’s survey is unique in the extent to which it quantifies the level of risk and the frequency of specific risky underwriting practices. The Federal Reserve Board conducts a Senior Loan Officer Opinion Survey on Bank Lending Practices, but its primary focus is credit availability. The Comptroller of the Currency’s annual Survey of Credit Underwriting Practices is closer in spirit to the FDIC’s survey in that it surveys bank examiners and has questions on credit risk, but it does not request information about the frequency of specific risky practices. 2. Empirical Studies Regulatory assessments of underwriting standards become especially important as banks respond to incentives to change their standards from time to time. In our view, one incentive that may induce changes in underwriting standards over time is capacity constraints—periodic constraints on the amount of risk banks can safely assume and, consequently, on the amount of credit banks can extend. Capacity constraints in the banking industry can arise from various sources: binding risk-based capital constraints, limited opportunities for deposit growth in particular markets, increases in large time-deposit funding costs, or macroeconomic weakness. In addition, examiner responses to the FDIC survey on underwriting practices indicate that the level of market competitiveness influences underwriting standards. Examiners have typically commented that the main reason banks loosen underwriting practices is competitive forces. [7] Here we offer a possible connection between periodic capacity constraints, the level of market competitiveness, and underwriting cycles in banking by drawing on research in property-casualty insurance markets. Gron (1994) applies the theory of capacity constraints to explain underwriting cycles in property-casualty insurance markets. She describes four stages in a property-casualty insurance underwriting cycle. The first stage is characterized by low profitability (and prices) and relatively high insurance capacity. In the second stage, profitability and prices rise abruptly in response to an unanticipated crisis, while the availability of insurance falls as a result of capacity constraints. In the third—post-crisis—stage, profitability and prices remain high while industry capacity gradually increases to more normal levels as new firms enter the market and existing firms expand. Finally, in the fourth stage, competitive pressures cause profitability and prices to fall while capacity remains relatively high. In our adaptation of the theory of capacity constraints to banking, we anticipate that banks loosen underwriting standards at the fourth stage rather than reduce the price of the loan (which directly affects profits). Gron’s finding of a negative relationship between capacity and underwriting margins (a measure of profitability) supports the capacity constraint theory in insurance markets over arbitrage theories that suggest no systematic relationship between capacity and underwriting margins. Although we do not empirically test the capacity constraint theory in this paper, we propose that banks’ responses to capacity constraints can create an underwriting cycle in which banks tighten or loosen their underwriting standards in response to competitive pressures. Haskel and Martin (1994) provide additional empirical support for the theory of capacity constraints as applied to industrial firms. Haskel and Martin find a positive relationship between profits and direct measures of capacity constraints for industrial firms in the United Kingdom. Previous empirical research to develop off-site surveillance models has accounted for underwriting standards indirectly through their impact on financial variables. These models estimate the probability of individual banks’ failure or their downgrade in CAMELS rating. With the rapid increase in the number of bank and thrift failures in the late 1980s and early 1990s, bank regulators took particular interest in off-site models. Several researchers have built models based on the experience of those years. Gilbert, Meyer, and Vaughan (2002) empirically compare the predictive ability of the Federal Reserve Board’s SEER failure prediction model with a model they develop to predict downgrades in bank condition from CAMELS ratings 1 or 2 to ratings 3, 4, or 5. They find that over one- and two-year test windows, their specialized downgrade model outperformed the SEER failure model by only a small margin. They conclude that a model specified to predict downgrades adds little predictive value to existing off-site failure prediction models. One limitation on applying these results more generally is that their study estimates the models on the basis of 1989 data and considers out-of-sample performance for a period—1991 to 1998—that was relatively stable. The stability of their test period makes it difficult to discern how their model would perform in more volatile economic states. Kolari et al. (2002) develop failure prediction models for national banks using both parametric logit and nonparametric trait recognition methods. They find that although both perform well with regard to in-sample classification of failing and nonfailing banks, trait recognition outperforms logit in predicting failures out of sample. Our study, in contrast, uses data on FDIC-supervised institutions, thus providing us with more data for both in-sample estimation and out-of-sample prediction. Estrella, Park, and Peristiani (2000) use three types of capital ratios—risk-weighted, leverage, and gross revenue—to predict bank failure. [8] They find that the most complex of the ratios—the risk-weighted ratio—is the strongest predictor of bank failure over long time horizons. However, the risk-weighted ratio is sometimes outperformed by the leverage ratio and the gross revenue ratio over horizons of less than two years. Their analysis illustrates the centrality of the capital ratio as a determinant of bank failure: the use of the capital ratio alone in a logistic regression model results in pseudo R-squared values as high as 13.5 percent. Data from underwriting surveys also inform monetary and supervisory policy makers about current banking industry practices and conditions and therefore have the potential to contribute to econometric forecasting models. Lown, Morgan, and Rohatgi (2000) and Lown and Morgan (2003) use the Federal Reserve’s Senior Loan Officer Opinion Survey to analyze the importance of credit availability to the economy. They conclude that shocks to lending standards (credit tightening or loosening) have a significant impact on both the volume of commercial loans and real output. To date, however, there has been no published research on the potential contribution of underwriting survey data to statistical models that predict bank performance and financial distress. We propose that survey data can shed light not only on the potential future effect of credit availability on the economy (as shown by Lown, Morgan, and Rohatgi [2000] and Lown and Morgan [2003]) but also on future bank performance. Using the FDIC survey data for underwriting practices, we test this hypothesis by controlling directly for bank examiners’ assessments of underwriting standards in off-site surveillance systems. 3. Sample and Data To investigate whether FDIC underwriting survey data can contribute to bank supervisors’ early-warning models, we used FDIC survey data from the period August 1, 1995, through December 31, 2002, a period that includes 6,937 survey observations. [9] This period was relatively benign for U.S. banks (the few bank failures that occurred were often attributed to idiosyncratic factors), [10] so it should provide a useful test of examiners’ ability to detect idiosyncratic weaknesses in underwriting practices as opposed to broad-based problems of credit quality. During this period, the requirements set by the Federal Deposit Insurance Corporation Improvement Act (FDICIA) for examination frequency were in effect. Specifically, annual safety-and-soundness examinations were required for all FDIC-insured banks except those that had assets under $250 million and composite CAMELS ratings of 1 or 2; these banks had to be examined once every 18 months. The FDIC is the federal supervisor for state-chartered banks that are not members of the Federal Reserve System, and to avoid duplication of examination expenses and the associated burdens on banks, the FDIC generally alternates examinations with state supervisory authorities. As a result, FDIC survey data are typically available for every second examination of FDIC-supervised banks, or about one examination every two to three years. Table 1 presents the survey questions and responses for the 1995–2001 period. As discussed above, the survey has undergone revision over time, and we control for this in our empirical analysis. The most significant survey change was made in October 1998, when the possible responses to several questions on risk in general underwriting practices were changed from relative to absolute risk rankings. That is, the possible responses were changed from characterizing risk as above average, average, or below average [11] to high, medium, or low based on supervisory standards. The change was made to improve the clarity and ease of interpretation of survey results. Relative risk rankings can be difficult to interpret, especially when overall industry risk is changing. To see this, one need only consider the likely differences in the absolute risk levels between banks with "above-average" risk in current underwriting practices during a banking crisis and banks with "above-average" risk during a period of record profitability. More is said below about these changes and how we control for them in the analysis. Since the purpose of this study is to investigate the potential contribution of FDIC survey data to off-site surveillance models, we use FDIC off-site surveillance models as our basis for comparison. The primary off-site surveillance model used by the FDIC is the Statistical CAMELS Off-Site Rating (SCOR) model. SCOR uses the balance-sheet and income-statement information that banks are required to report to their primary federal supervisor each calendar quarter-end (Call Reports). The SCOR model attempts to predict CAMELS ratings by relating 12 financial ratios to each bank’s future composite rating (similar models are developed for the component ratings). In addition to the 12 SCOR variables, we include controls for economic conditions in banks’ local markets by using current and lagged growth rates of state personal income. Previous research by the FDIC (Nuxoll, O'Keefe, and Samolyk [2003]) suggests that the boom and bust economic cycle that contributed to bank failures in the 1980s and 1990s is captured by state personal-income growth. 4. Methodology We examine the predictive content of the FDIC survey data using two types of models. The first type forecasts banks’ examination ratings (CAMELS ratings) received during a given year on the basis of prior year-end values of variables that we hypothesize determine bank safety and soundness. The second type models nonperforming assets using similar explanatory variables. We selected these two models because the dependent variables (CAMELS ratings and nonperforming assets) are the broadest and, from a supervisory perspective, the most significant indicators of bank safety and soundness. The two dependent variables are also measured in very different ways; that is, discrete CAMELS ratings are reported by bank supervisors, and continuous nonperforming assets are reported by bank management. As a result, the two models provide fairly robust tests of the potential contribution of survey responses to off-site surveillance models. For the first type of model, we estimate four alternative specifications of the CAMELS-rating forecast model to show the relative contributions of groups of explanatory variables. Specification 1, which serves as our basis of comparison, uses as explanatory variables (a) past financial variables contained in the FDIC’s SCOR model, and (b) past measures of state economic conditions, as measured by state personal-income growth lagged one to five years. Specification 2 differs from specification 1 by including as additional explanatory variables (c) past FDIC underwriting survey responses. Specification 3 expands the set of explanatory variables used in specification 2 to include (d) past CAMELS ratings. Equation 1 presents the broadest specification (specification 3) of the model in general form:
Specification 4 of the model is used to test the potential overlap between the information contained in the past FDIC surveys and past CAMELS ratings. This specification excludes past FDIC surveys as explanatory variables but includes all the other items in the 3rd, or full, specification. The SCOR model uses the same set of financial variables to predict the CAMELS composite and six component ratings (Capital, Asset quality, Management, Earnings, Liquidity, and Sensitivity to market risk). A review of the FDIC survey questions as presented in table 1, however, indicates that they should have a narrower scope of influence on examination ratings than the SCOR financial variables. We anticipate that underwriting practices are most closely related to examiners’ assessments of the quality of bank management, as measured by the management component rating, although the timing of the relationship would seem to be concurrent, since the survey focuses on "current" lending practices. It is reasonable, however, to expect that current underwriting practices affect future loan quality and future overall safety and soundness. For these reasons, we estimate equation 1 using three dependent variables: composite CAMELS ratings, the asset component ratings, and the management component ratings. We estimate all specifications of the prediction model in equation 1 using ordered logistic regression. All financial measures are expressed as percentages of contemporaneously measured bank assets. In specifications where lagged CAMELS ratings are used as explanatory variables, the ratings are from examinations occurring in the year from which year-end financial data are used. Similarly, the CAMELS ratings used as dependent variables are from examinations occurring within one year of the date of the financial data used as explanatory variables. CAMELS composite and component ratings are ordinal indices ranging from 1 (best rating) to 5 (worst rating). Because banking conditions were very favorable during the 1995–2002 period for which we have FDIC survey data, there have been very few poorly rated banks. Between 1995 and 2002, of the approximately 6,900 examinations that make up our sample, the distribution of composite CAMELS ratings was as follows: 40.7 percent rated 1, 50.9 percent rated 2, 7.6 percent rated 3, 0.7 percent rated 4, and 0.1 percent rated 5. The small size of some CAMELS rating groups made it impossible to estimate ordinal logistic regressions using all five rating levels, as would normally be done. We therefore grouped CAMELS ratings of 3, 4, and 5 into one category and maintained the CAMELS 1 and 2 rating categories. We did this for both the composite and the component ratings. Since the focus of bank supervisors’ off-site surveillance is potential deterioration in CAMELS 1- and 2-rated banks, we believe the use of a three-level CAMELS rating does not compromise our analysis. [12] As shown in table 1, FDIC survey responses for general underwriting practices are three-level ordinal responses, with level 1 representing the lowest perceived risk (below-average risk, low absolute risk, or low frequency of risky practices) and level 3 representing the highest perceived risk (above-average risk, high absolute risk, or frequent risky practices). To allow for differences in outcomes (future condition or CAMELS rating) across perceived risk levels, each survey question was measured using two dummy variables: a dummy set equal to one for low-risk responses, and zero otherwise; and a dummy set equal to one for high-risk responses, and zero otherwise. The middle or average responses were the omitted dummy. For our second type of model (nonperforming assets), equation 2 presents the basic model in general form: Our approach to estimation of equation 2 is parallel to the approach we used for equation 1. Specifically, we use the same four specifications of the model (explanatory variables) as before. The major difference in estimating equation 2 is that we model only total nonperforming assets, expressed as a percentage of bank assets, as the dependent variable. Nonperforming assets are defined as the sum of all loans and leases past due 30–89 days, loans and leases past due 90 days or more, nonaccrual loans and leases and all other real estate owned (included repossessed real estate). Equation 2 is estimated using ordinary least squares. 5. Results The FDIC survey could contribute to off-site surveillance in at least two ways. The first is by contributing to models that forecast supervisory ratings and other quantifiable bank risk measures, such as nonperforming assets. These contributions are perhaps the easiest to quantify. Here we document them and show that they are statistically and economically meaningful. The second way the FDIC survey could contribute to off-site surveillance is by helping bank supervisors understand the actual, current sources of bank risk. We also document this latter contribution and show that individual survey questions have persistent and logical relationships with future bank risk. 5.1 Prediction of CAMELS Ratings: In-Sample Results Tables 2 – 4 (table 2a, table2b, table 3a, table 3b, table 4a, table4b) show the results of logistic regressions of the four specifications of equation 1 discussed above. The regressions are designed to predict the likelihood of receiving a poorer future CAMELS rating. To account for the changes in possible responses to questions in October 1998, we estimate the models using survey data from two periods: January 1996 – September 1998 and October 1998 – December 2001 (hereinafter "1996–1998" and "1998–2001," respectively). We combine all responses within each of the two periods and estimate the resulting panels of data using ordered logistic regression. [13] We are interested in panel estimations for both periods for several reasons. First, any test of the relationships between survey results and bank CAMELS ratings is also a test of the ability of the survey to accurately measure the risks in underwriting practices. The change from relative to absolute risk rankings in the survey was intended to improve the survey’s measurement of underwriting risk, and we wish to see if this intended improvement is supported by the data. Second and more importantly, we wish to see if the relationships between underwriting practices and banks’ CAMELS ratings are robust over time. Generally speaking, as we explain in the pages that follow, all results are in close agreement with our expectations. Discussed here are the results for composite CAMELS ratings and then for the asset quality and management component ratings. Because of the large number of explanatory variables included in the models as well as the number of model specifications tested, this section summarizes results and addresses only statistically significant relationships (statistical significance levels between 1 and 10 percent). Tables 2a and 2b show that for both the 1996–1998 and 1998–2001 periods, the likelihood of receiving a poorer composite CAMELS rating is negatively related to equity capitalization and income before taxes and extraordinary items. The likelihood of receiving a poorer composite CAMELS rating is also negatively related to liquid assets and gross loan charge-offs in the 1998–2001 period, but not consistently so for all model specifications. For both the 1996–1998 and 1998–2001 periods, the likelihood of receiving a poorer composite CAMELS rating is positively related to the allowance for loan losses, loans past due 30–89 days, loans past due 90 days or more, nonaccrual loans and leases, other real estate owned, volatile liabilities, and provisions for loan losses. State personal-income growth rates show a less-consistent relationship with future composite CAMELS ratings, but one- and two-year lagged growth rates are positively related to the likelihood of receiving poorer composite CAMELS ratings in the 1998–2001 period. Similarly, the relationships between FDIC survey results and the likelihood of receiving a poorer composite CAMELS rating are in strong agreement with our expectations. Tables 2a and 2b show that the likelihood of receiving a poorer composite CAMELS rating is positively associated with the dummy for high perceived risk in underwriting practices (above-average risk, high absolute risk, or frequent risky practices) and negatively related to the dummy for low perceived risk in underwriting practices (below-average risk, low absolute risk or low frequency of risky practices). Further, for 1996–1998 and 1998–2001 we find that FDIC survey data add significant explanatory power to the SCOR model. Comparisons of model specifications 1 and 2 in tables 2a and 2b show that for both periods, the FDIC survey data increase the overall explanatory power of the model. This can be seen when one compares the Akaike Information Criteria with Somers’ D statistics. [14] A Chi-Square test of the joint significance of the survey data in specification 2 shows that for both periods, the survey explanatory variables are jointly significant at the 95 percent confidence level. One interesting result is that the changes in the survey responses from relative to absolute risk levels (as seen when one compares results for the two periods) do not alter the significance of the survey data in the forecasting models. In addition, comparisons of specifications 2 and 3 show that the inclusion of dummy variables for initial composite CAMELS ratings in the models reduces the number of statistically significant survey explanatory variables. It is reasonable to expect that since survey data characterize one portion of the information used by examiners to determine CAMELS ratings, initial CAMELS ratings will subsume some of the informational content of survey data. [15] While specifications 3 and 4 are extremely close in overall explanatory power, a Chi-Square test of the joint significance of the survey data in specification 3 shows that for both periods, the survey explanatory variables are jointly significant at the 95 percent confidence level. Tables 3a and 3b show the results for models that attempt to predict asset component ratings. The relationships between the SCOR explanatory variables and future asset component ratings are similar to those seen with future composite CAMELS ratings. Equity capitalization and income before taxes and extraordinary items are negatively related to the likelihood of receiving a poorer asset component rating for both periods, and for the 1998–2001 period the negative relationship is true for liquid assets and loans plus securities with maturities of five years or more. For both the 1996–1998 and 1998–2001 periods the likelihood of receiving a poorer asset component rating is positively related to allowance for loans and lease losses, loans past due 30–89 days, loans past due 90 days or more, nonaccrual loans and leases, and other real estate owned. Similarly, the relationships between the survey data and asset component ratings are very similar to those between the survey data and CAMELS composite ratings. Finally, changes in the explanatory power of the model across all four specifications of the asset component forecast model are very similar to those seen with the CAMELS composite rating prediction. For brevity, therefore, we will not repeat that discussion. The results of estimation of the management component rating model are presented in tables 4a and 4b. The relationships that the SCOR and survey explanatory variables have with future management component ratings are very similar to those seen with future composite CAMELS and asset component rating forecast models. In addition, the marginal changes in model explanatory power across the four specifications are the same as those seen with the future composite CAMELS and asset component ratings forecast models. [16] One result we should highlight is that the general explanatory power of the forecast models is less when the attempt is made to forecast management component ratings than it is in the attempt to forecast composite CAMELS and asset component ratings. At this point, one may question the value of the underwriting survey responses for off-site surveillance, given that the explanatory power of survey responses is largely subsumed by CAMELS ratings that are contemporaneous with survey responses. The FDIC does not, however, include CAMELS ratings as explanatory variables in the SCOR off-site surveillance model. CAMELS forecast models that include lagged CAMELS ratings as explanatory variables tend to produce forecasts that are clustered around those lagged CAMELS values, since CAMELS ratings change infrequently. We expect, however, that the underlying riskiness of banks is more evenly distributed than the clustered results would suggest. That is, not all CAMELS 1-rated banks are of equal risk; the same can be said for other CAMELS ratings. In addition, if a bank’s financial condition has changed since the last examination, off-site models that omit lagged CAMELS ratings will place greater weight on this changed condition. [17] For these and other reasons, from our perspective the most important tests of the contribution of underwriting survey data to off-site surveillance models are those based on models without lagged CAMELS ratings as explanatory variables, that is, model specifications 1 and 2. [18] 5.2 Prediction of CAMELS Ratings: Out-of-Sample Results The true measure of the contribution of survey data to off-site surveillance models is their contribution to out-of-sample forecasts. This section presents the results of out-of-sample forecasts of CAMELS ratings, using essentially the same approach as for the in-sample forecasts. To allow for several forecast periods, we use an annual forecast model. That is, forecast models are designed to show how explanatory variables measured during one calendar year predict CAMELS ratings received over the next calendar year. For example, we estimate the ordered logistic regression for model specification 2 using survey data for 1996, year-end 1996 Call Report values of the SCOR variables, and lagged state personal-income growth rates. The dependent variable in this estimation is the composite CAMELS rating received during 1997. We next apply these estimated relationships (estimated explanatory variables’ coefficients) to survey data and SCOR variables for 1997 to predict the composite CAMELS ratings that banks would receive in 1998. The model specifications are otherwise identical to those discussed in the section on in-sample results, with one exception. Since data on one survey question (the frequency with which the bank fails to require a material principal reduction before renewing loan terms) did not become available until October 1996, we drop this variable from the forecast model. Dropping it allows us to extend the sample period back to include all of 1996 and adds another forecast year to our tests. For the sake of brevity, we do not present the estimated model coefficients for the annual logistic regressions. Rather, we proceed directly to measures of predictive accuracy. Figure 1 shows the overall predictive accuracy of the CAMELS rating forecasts for all model specifications. In measuring overall accuracy, we round the predicted CAMELS rating to the nearest integer value and use that value as the forecast. [19] The results generally parallel those seen with the in-sample results discussed above. The inclusion of survey data (specification 2) enhances the overall accuracy of models that predict CAMELS composite, asset component, and management component ratings, relative to specification 1. In addition, specifications 3 and 4 have very similar predictive accuracy for all categories of CAMELS ratings tested. As shown in figures 2–4, similar results are also generally found when assessed by initial CAMELS rating groups. These latter comparisons, however, require us to consider Type 1 and 2 error rates. For example, a greater proportion of CAMELS 1-rated banks might be forecast correctly at the expense of forecasting fewer CAMELS 2- or 3-rated banks correctly. Figures 2–4 do not show the Type 1 and Type 2 error rates, but only the percentage of forecasts that are correct. Figures 2–4 show that in cases when model specification 2 had greater accuracy than specifications 3 or 4 in predicting any one CAMELS-rating group, it was less accurate in forecasting some other CAMELS rating group. As an alternative test of the predictive accuracy of the models, we compute the Pearson’s partial correlation coefficient between actual future CAMELS ratings and the predicted ratings (without rounding the predicted ratings to integer values). We combine forecasts across both the 1996–1998 and 1998–2001 periods, since previous results indicate similar predictive accuracy for both periods. As shown in table 5, the correlation coefficient increases when survey data are added to the model (compare specifications 1 and 2) for all CAMELS rating forecasts. In addition, the correlations between actual and predicted CAMELS are greatest for specifications 3 and 4. 5.3 Nonperforming-Asset Models Equation 2 provides an additional test of the potential contribution of FDIC survey data to off-site surveillance models. If lapses in underwriting practices occur, we expect the bank to be more exposed to borrowers who are unable to meet interest and principal payments. Tables 6 and 7 present the results of ordinary least squares regressions of the relationships between nonperforming assets and the same types of explanatory variables used for CAMELS prediction. Nonperforming assets are hypothesized to be determined by prior year-end nonperforming assets, prior year-end values of all SCOR model financial variables, state personal-income growth rates lagged one to five years, initial examination ratings, and survey data. We also include as an explanatory variable the interval (in days) between the date of the survey data and the date of the Call Report from which the dependent variable (nonperforming assets) was measured. Since it may take some time for lending practices to result in problem loans, a control for this interval is needed. In all other respects, the four specifications we use to estimate the nonperforming asset prediction model (equation 2) are the same as those for CAMELS prediction. Tables 6 and 7 show that nonperforming assets are positively related to lagged nonperforming assets and equity capitalization for both the 1996–1998 and 1999–2001 periods but show no consistent relationship with other financial variables across both periods. However, nonperforming assets increase with high-risk underwriting practices and decrease with low-risk underwriting practices for both the 1996–1998 and 1999–2001 periods. Finally, tests of the joint significance of the survey explanatory variables in specification 1 show that the survey data are jointly significant, and similar tests of specification 3 yield the same result. We did not perform out-of-sample tests of the nonperforming-asset prediction models because of the limited number of forecasts that might be produced. As constructed, our models would have allowed for only two out-of-sample estimations, and we do not feel this provides enough information to assess the out-of-sample predictive accuracy of the models. 6. Summary and Conclusions We conclude that the examiners’ risk assessments of underwriting practices do contribute to early-warning systems in at least two ways. First, these assessments, as captured by the FDIC underwriting survey, contribute to models that forecast CAMELS ratings. Survey responses can be used to predict not only composite CAMELS ratings but also asset component ratings and, to a lesser extent, management component ratings. Moreover, our results indicate that inclusion of survey responses in the FDIC’s SCOR off-site surveillance model would improve SCOR’s predictive accuracy. In addition, we find that survey responses contribute to models that attempt to forecast nonperforming assets. Specifically, we find that higher (lower) risk in underwriting practices is associated with subsequent increases (decreases) in nonperforming assets generally. Second, we argue that survey responses add to the usefulness of off-site surveillance models by pointing to additional potential sources of bank risk. Bank supervisors need to know not only which banks have increased in riskiness but also what the likely causes of the increase in risk are. It is important for bank supervisors to know the possible reasons for increased bank risk so that they know where to direct their efforts. Our results show that survey responses give clear and consistent signals about the contribution of underwriting risk to overall risk and therefore provide useful direction to bank supervisors. REFERENCES Collier, Charles, Sean Forbush, Daniel Nuxoll, and John O’Keefe. 2003. The SCOR System of Off-Site Monitoring. FDIC Banking Review 15, no. 3:17–32. Estrella, Arturo, Sangkyun Park, and Stavros Peristiani. 2000. Capital Ratios as Predictors of Bank Failure. Federal Reserve Bank of New York Economic Policy Review 6, no. 2:33–52. Federal Deposit Insurance Corporation (FDIC). 1997. History of the Eighties—Lessons for the Future. Vol. 1, An Examination of the Banking Crises of the 1980s and Early 1990s. FDIC. ———. February 2002. Section 3. DOS Manual of Examination Policies. FDIC. Gilbert, R. A, Andrew P. Meyer, and Mark D. Vaughan. 2002. Could a CAMELS Downgrade Model Improve Off-Site Surveillance? Federal Reserve Bank of St. Louis Economic Review 84, no. 1:47–64. Gron, Anne. 1994. Capacity Constraints and Cycles in Property-Casualty Insurance Markets. RAND Journal of Economics 25, no. 1:110–23. Haskel, Johnathan, and Christopher Martin. 1994. Capacity and Competition: Empirical Evidence on U.K. Panel Data. Journal of Industrial Economics 42, no. 1:23–44. Kolari, James, Dennis Glennon, Hwan Shin, and Michele Caputo. 2002. Predicting Large U.S. Commercial Bank Failures. Journal of Economics and Business 54:361–87. Lown, Cara S., and Donald P. Morgan. Forthcoming. The Credit Cycle and the Business Cycle: New Findings Using the Survey of Senior Loan Officers. In Financial Market Behavior and Appropriate Regulation over the Business Cycle, Proceedings of the 38th Annual Conference on Bank Structure and Competition. Federal Reserve Bank of New Chicago. Lown, Cara S., Donald P. Morgan, and Sonali Rohatgi. 2000. Listening to Loan Officers: The Impact of Commercial Credit Standards on Lending and Output. Federal Reserve Bank of New York Economic Policy Review 6, no. 2:1–15. Nuxoll, Daniel, John O’Keefe, and Katherine Samolyk. 2003. Do Local Economic Data Improve Bank Off-Site Monitoring Models? FDIC Banking Review 15, no. 2:39–53. Figure 1. Overall Accuracy of CAMELS Rating Predictions Figure 2. Accuracy of CAMELS Composite Rating Predictions by Rating Group Figure 3. Accuracy of CAMELS Asset Quality Rating Predictions by Rating Group Figure 4. Accuracy of CAMELS Management Rating Predictions by Rating Group [1]See FDIC (2002). [2] Part 364 of the FDIC Rules and Regulations covers "Credit Underwriting" in a general sense, and Part 365 provides a list of specific factors for underwriting standards. Part 365 also covers loan administration. [3] Low: the level of risk imposed on the institution does not warrant notice by bank supervisors even when factors that might offset the risk are ignored. Medium: the level of risk should be brought to the attention of bank supervisors. There may or may not be factors that offset the risk incurred by the institution; however, the level of risk raises concerns when considered apart from these offsetting factors. High: the level of risk is high and therefore should be brought to the immediate attention of bank supervisors. There may or may not be factors that offset the risk incurred by the institution; however, the level of risk is high when viewed in isolation. [4] Never or infrequently: the institution does not engage in the practice, or does so only to an extent that does not warrant notice by bank supervisors. Frequently enough to warrant notice: the institution engages in the practice often enough for it to be brought to the attention of bank supervisors. There may or may not be factors that offset the risks the practice imposes on the institution. Commonly or as standard procedure: the practice is either common or standard at the institution and therefore should be brought to the attention of bank supervisors. There may or may not be factors that offset the risks the practice imposes on the institution. [5] The survey also asks examiners to identify potentially risky loan categories in which the bank is actively lending, such as unguaranteed portions of small business administration loans, subprime loans, dealer paper loans, low-documentation business loans, high loan-to-value home equity loans, or any other category not listed. In addition, the survey asks examiners to comment on which, if any, of these loan categories pose more-than-normal risk to the bank. [6] For a complete history of this crisis, see FDIC (1997). [7] FDIC, Report on Underwriting Practices, various issues. [8] Estrella, Park, and Peristiani (2000) define the three capital ratios as follows: The risk-weighted capital ratio is the ratio of Tier 1 capital (which includes common stock, common stock surplus, retained earnings, and some perpetual preferred stock) to risk-weighted assets. The leverage ratio is Tier 1 capital divided by the quarterly average of total tangible assets. The gross revenue ratio is the ratio of Tier 1 capital divided by total interest and noninterest income before the deduction of any expenses. [9] Although the survey began in February 1995, not until August of that year were several key questions added to it. [10] Between 1995 and 2002, 46 FDIC-insured banks failed. Fraud was considered a significant factor in 7 (15.2 percent) of the failures, whereas of the 472 FDIC-insured bank failures that occurred between 1990 and 1994, fraud was found to be a significant factor in 27 (5.7 percent). [11] As noted above, the survey was designed in consultation with senior examiners. They agreed that examiners had a general feel for what was considered "below average," "average," and "above average" risk. No formal definitions were written. [12] Once a bank is CAMELS-rated 3 or worse, supervisors increase surveillance and rely more on on-site examinations than on off-site surveillance. See Collier, Forbush, Nuxoll, and O’Keefe (2003) for additional discussion of this focus. [13] Because we control for changes in economic conditions using state personal-income growth, we do not include dummy variables for time or geographic region in the models. [14] Larger values for the Somers’ D statistic indicate better model fit, while smaller values for the Akaike Information Criteria indicate better model fit. [15] The initial composite CAMELS rating and survey data are taken from the same bank examination, so the overlap in information is not surprising. [16] Robustness tests were performed on model specifications 2 and 3 for all CAMELS rating models. Specifically, we included only those survey questions that were consistently defined for both the 1996–1998 and 1998–2001 periods. The consistently defined survey questions measured risk in terms of the frequency of risky practices (see table 1). The model specifications were identical to those shown in tables 2–4 (table 2a, table2b, table3a, table3b, table4a, table4b) in all other respects. Our results regarding the marginal contribution of the survey responses are essentially the same as those seen in tables 2–4. Finally, pooled regressions that combined data for both periods also yielded similar results. [17] Since bank examinations are required only every 12 to 18 months, there can be a considerable difference between the dates of lagged CAMELS ratings and the financial data that are used as explanatory variables in off-site surveillance models. [18] The reasons lagged CAMELS ratings are excluded from the FDIC’s SCOR model are discussed at length in Collier, Forbush, Nuxoll, and O’Keefe (2003), appendix 1. [19] For example, a predicted CAMELS rating of 2.55 is rounded up to 3, while a predicted CAMELS rating of 2.45 is rounded down to 2. Since actual CAMELS ratings are integer values ranging from 1 to 5, some method of translating predicted CAMELS ratings into integers is needed in order to assess the accuracy of predictions. While rounding is the simplest way to accomplish this, other approaches could have been used. For example, one might round up all values that are more than 0.25 from the nearest integer, so that predicted CAMELS of 1.26 and 2.39 are translated into ratings of 2 and 3, respectively.
|
| Home Contact Us Search Help SiteMap Forms Freedom of Information Act (FOIA) Service Center Website Policies USA.gov |
| FDIC Office of Inspector General |