Mammography
Mammography Percentages by Race and Ethnicity
The graph below shows the percentage of women aged 40 years and older who had a mammogram in the last two years, grouped by race and ethnicity and the year when their mammogram was done.
In 1994, more American Indian/Alaska Native women had a mammogram in the last two years than women of any other racial or ethnic group, and Hispanic or Latino women were least likely to have had a mammogram in the last two years. In 2005, American Indian/Alaska Native women were still most likely to have had a mammogram in the last two years, and Asian women were the least likely.
Percentage of U.S. Women Aged 40 Years and Older Who Have Had a Mammogram in the Last 2 Years by Race* and Ethnicity†‡
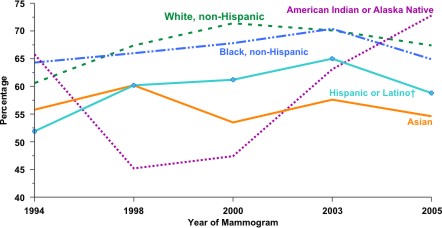
| Race or Ethnicity | 1994 | 1998 | 2000 | 2003 | 2005 |
|---|---|---|---|---|---|
| Non-Hispanic white | 60.6 | 67.4 | 71.4 | 70.1 | 67.4 |
| Non-Hispanic black | 64.3 | 66.0 | 67.8 | 70.4 | 64.9 |
| American Indian/Alaska Native | 65.8 | 45.2 | 47.4 | 63.1 | 72.8 |
| Asian | 55.8 | 60.2 | 53.5 | 57.6 | 54.6 |
| Hispanic or Latino† | 51.9 | 60.2 | 61.2 | 65.0 | 58.8 |
*Estimates for Native Hawaiian or Other Pacific Islander are either not available or are considered unreliable.
†The group, or category, called "Hispanic" may include race categories like white, black, American Indian/Alaska Native, and Asian/Pacific Islander.
‡Source: Centers for Disease Control and Prevention, National Center for Health Statistics, National Health Interview Survey in Health, United States 2007. (PDF-6.01MB)
Mammography Percentages by Level of Education
The percentages of mammography screening vary by level of education. Women with the most years of schooling are most likely to have had a mammogram in the last two years. The graph below shows the percentage of women aged 40 years and older who had a mammogram in the last two years, grouped by their highest level of education and the year when their mammogram was done.
Percentage of U.S. Women Aged 40 and Older Who Have Had a Mammogram in the Last 2 Years by Education Level*
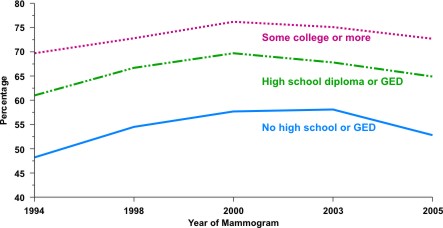
| Education Level | 1994 | 1998 | 2000 | 2003 | 2005 |
|---|---|---|---|---|---|
| No high school diploma or GED | 48.2 | 54.5 | 57.7 | 58.1 | 52.8 |
| High school diploma or GED | 61.0 | 66.7 | 69.7 | 67.8 | 64.9 |
| Some college or more | 69.7 | 72.8 | 76.2 | 75.1 | 72.7 |
*Source: Centers for Disease Control and Prevention, National Center for Health Statistics, National Health Interview Survey in Health, United States 2007. (PDF-6.01MB)
Mammography Percentages by Age
The percentages of mammography screening vary by age. Women aged 50 to 64 years are most likely to have had a mammogram in the last two years, followed by older women and younger women. The graph below shows the percentage of women aged 40 years and older who had a mammogram in the last two years, grouped by age and the year when their mammogram was done.
Percentage of U.S. Women Aged 40 and Older Who Have Had a Mammogram in the Last 2 Years by Age*
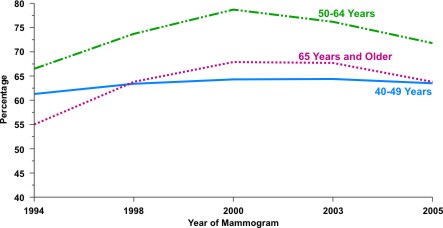
| Age Group | 1994 | 1998 | 2000 | 2003 | 2005 |
|---|---|---|---|---|---|
| 40 to 49 years | 61.3 | 63.4 | 64.3 | 64.4 | 63.5 |
| 50 to 64 years | 66.5 | 73.7 | 78.7 | 76.2 | 71.8 |
| 65 years and older | 55.0 | 63.8 | 67.9 | 67.7 | 63.8 |
*Source: Centers for Disease Control and Prevention, National Center for Health Statistics, National Health Interview Survey in Health, United States 2007. (PDF-6.01MB)
Contact Us:
- Centers for Disease Control and Prevention
Division of Cancer Prevention and Control
4770 Buford Hwy NE
MS K-64
Atlanta, GA 30341 - 800-CDC-INFO
(800-232-4636)
TTY: (888) 232-6348
24 Hours/Every Day - cdcinfo@cdc.gov
