U.S. Office of Personnel Management
The Fact Book
Federal Civilian Workforce Statistics 1997 Edition
|
U.S. Office of Personnel ManagementThe Fact BookFederal Civilian Workforce Statistics 1997 Edition |
The Data in Graphic and Spreadsheet Format
 |
 |
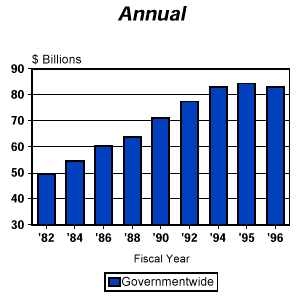
| Fiscal Year (FY) | FY82 | FY84 | FY86 | FY88 | FY90 | FY92 | FY94 | FY95 | FY96 | ||
|---|---|---|---|---|---|---|---|---|---|---|---|
| Annual Payroll (in $billions) | 49.6 | 54.8 | 60.2 | 63.7 | 71.1 | 77.5 | 83.1 | 84.4 | 83 | ||
|
14.8 | 10.5 | 9.9 | 5.8 | 11.6 | 9 | 7.2 | 1.6 | -1.7 |
| Note: | Data exclude U.S. Postal Service and Postal Rate Commission. |
|---|
(r) = Revised
Source: Monthly Report of Federal Civilian Employment (SF 113-A); Office
of Workforce Information. (202) 606-2684
OWI@OPM.GOV
Updated September 04, 1997