

Images & Animations
-
Credit
NASA/Goddard Space Flight Center Scientific Visualization Studio. Source data courtesy of HAO & NSO PSPT project team. HAO is a division of the National Center for Atmospheric Research which is supported by the National Science Foundation.
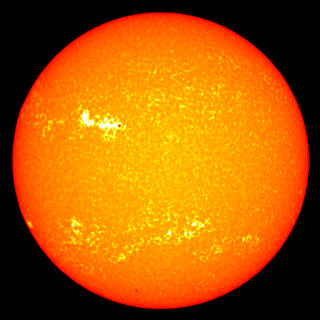
The Solar 'Constant' - Faculae vs. Sunspots
Three views of the Sun showing different levels of solar activity. The color table has been altered to enhance the appearance of the faculae (white regions) which are hotter than sunspots (red-black regions) and whose greater total area contribute to increasing the solar flux reaching the Earth.
Low solar activity - October 28, 1998
Metadata
-
Sensor
PSPT/CaIIK Camera -
Animation ID
2644 -
Video ID
None -
Start Timecode
00:00:00:00 -
End Timecode
00:00:00:00 -
Animator
Tom Bridgman -
Studio
SVS -
Visualization Date
2002/11/30 -
Scientist
William R. Ochs (NASA/GSFC), Robert F. Cahalan (NASA/GSFC), Gary Rottman (University of Colorado/LASP) -
Keywords
Sun, Faculae, Sunspots, Solar Cycle -
DLESE Subject
Space science -
Imagemods
Images were resampled so the solar disk has the same apparent size on all images (varying Earth-Sun distance effect removed) and pixels resampled to square aspect. -
Data Date
2002-04-27T18:03:48.864Z, 2001-03-28T18:03:20.113Z, 1998-10-28T19:33:41.000Z -
Animation Type
Stills -
Other Credits
Special thanks to Vanessa George (University of Colorado/LASP) and Randy Meisner (Michigan State University)