


2005 CCDF State Expenditure Data
FY 2005 CCDF State Expenditures as of September 30, 2005 (Spending from All Appropriation Years): Overview | All Expenditures Detailed Summary | All Expenditures Categorical Summary
| Overview - Download in Word (102) or PDF (35 KB)format. |
|---|
CHILD CARE AND DEVELOPMENT FUND
FISCAL YEAR 2005 STATE SPENDING FROM ALL APPROPRIATION YEARS
Background:
The Child Care and Development Fund (CCDF) financial expenditure report (ACF-696) details expenditures from each of the CCDF funding streams (Mandatory, Matching and Discretionary), as well as funds transferred from the Temporary Assistance for Needy Families (TANF) program to CCDF. Reported expenditures are for administration, direct and non-direct services, and quality activities including Congressionally- mandated earmarks for (1) Child Care and Quality Improvement Activities; (2) Infant and Toddler Quality Improvement; and (3) Child Care Resource and Referral and School Age Care. States continue to report on their expenditures of CCDF funds until expended.
Highlights:
This summary provides information obtained from the State CCDF ACF-696 reports submitted for the Fiscal Year (FY) 2005 CCDF expenditure year from all open appropriation years. States expended a total of $9.4 billion of combined Federal and State funds, which includes both CCDF and TANF transfers into CCDF. An additional $1.3 billion was expended in "direct spending for child care services" reported in the TANF program. Expenditures of Federal CCDF funds were $7.0 billion, comprised of $5.3 billion from FY 2005 and $1.7 billion from prior year funds (FY 2000 through FY 2004). Expenditures of State Matching and Maintenance of Effort (MOE) funds were $2.4 billion, which includes $2.2 billion of FY 2005 funds and $150 million of prior year funds (FY 2000 through FY 2004).
Table 1 – Expenditures in FY 2005 by Appropriation Year 1
| FY 2000 | FY 2002 | FY 2003 | FY 2004 | FY 2005 | Total by Fund | |
|---|---|---|---|---|---|---|
| Mandatory | 2,873,489 | 2 | 579,599 | 133,222,179 | 1,116,314,230 | 1,252,989,499 |
| Matching Federal | - | - | - | 237,317,935 | 1,286,519,086 | 1,523,837,021 |
| Discretionary | - | - | 123,543,489 | 1,194,697,302 | 2,923,839,696 | 4,242,080,487 |
| Subtotal Federal | 2,873,489 | 2 | 124,123,088 | 1,565,237,416 | 5,326,673,012 | 7,018,907,007 |
| Matching State | - |
- |
32,060,859 | 147,910,956 | 1,253,211,246 | 1,433,183,061 |
| CCDF MOE | - |
- |
(13,411,153) | (16,240,092) | 958,009,288 | 928,358,043 |
| Subtotal State | - |
- |
18,649,706 | 131,670,864 | 2,211,220,534 | 2,361,541,104 |
| Subtotal CCDF | 2,873,489 | 2 | 142,772,794 | 1,696,908,280 | 7,537,893,546 | 9,380,448,111 |
| TANF Direct | (14,552) | 49,686 | 8,765,292 | 109,032,031 | 1,148,358,077 | 1,266,190,534 |
| TOTAL | 2,858,937 | 49,688 | 151,538,086 | 1,805,940,311 | 8,686,251,623 | 10,646,638,645 |
1 No FY 2001 funds were expended in FY 2005. TANF Direct spending data for FY 2005 received from Office of Grants Management/Division of Mandatory Grants.
Administration. During FY 2005, States expended $268 million or 3 percent of total Federal and State expenditures (including MOE). Administrative spending increased from the $212 million expended in FY 2004. The 5 percent administrative cap stipulated by legislation applies to individual appropriation years. Compliance with this requirement is assessed at the end of the liquidation period.
Direct Services. CCDF expenditures on direct child care services were $7.5 billion or 79 percent of the total Federal and State expenditures (including MOE) in FY 2005. CCDF spending on direct child care services in FY 2004 totaled $7.8 billion.
Non-Direct Services. States spent $731 million in non-direct services, or 8 percent of total State and Federal expenditures in FY 2005. The breakdown of non-direct services expenditures is $64 million on child care computer infor m ation systems, $272 million on certificate programs and eligibility determinations and $395 million for other costs. For FY 2004, states reported spending $452 million.
Quality Activities. States spent $920 million or 10 percent of total Federal and State expenditures (including MOE and Earmarked funds) in FY 2005. Quality expenditures in FY 2004 were $920 million. The statute requires that a minimum of four percent of CCDF expenditures be spent on quality activities (excluding Earmarked funds) and applies to individual appropriation years. Compliance with this requirement is assessed at the end of the liquidation period.
Chart 1 - Total Expenditures by Category (in millions)
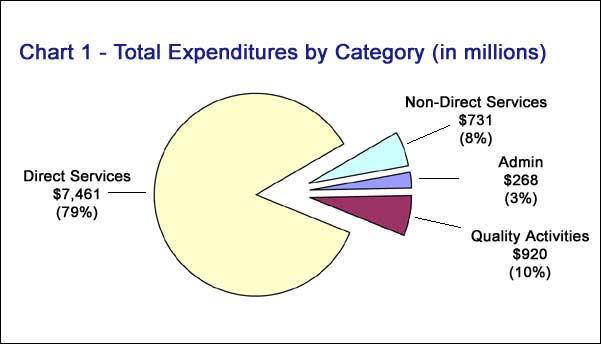
1/ TANF Direct Spending on Child Care expenditures are not categorized; therefore, the $1.3 billion spent in TANF Direct Spending are not included in this chart
2/ Non-Direct Services include expenditures related to the operation of voucher programs, eligibility determination and re-determination, and developing and maintaining computer systems
3/Quality Activities include the expenditures of Earmarked funds
Unobligated Balances. One State released $2.6 million, or 0.2 percent of FY 2005 Matching funds, to be reallocated to States for FY 2006. Twenty-seven States reported unobligated balances of $297 million, or 7.4 percent of FY 2005 Discretionary funding including TANF transfers. States have an additional year to obligate these funds.
Unliquidated Funds. Forty States reported unliquidated balances of $1.2 billion comprised of Mandatory funding (FY 2004 and 2005), Discretionary (FY 2004 and 2005) and Matching (FY 2005). Mandatory funds are available until expended as all States met the obligation requirement in the award year. States have an additional year to liquidate the FY 2004 Discretionary unliquidated balances and two years to liquidate the FY 2005 balances. FY 2005 Matching unliquidated balances must be expended by 9/30/06.
Table 2 - Unliquidated Funds as of 9/30/2005
| FY 2004 | FY 2005 | Total by Fund | |
|---|---|---|---|
| Mandatory | 1,360,853 |
61,210,552 | 62,571,405 |
| Matching Federal | - |
198,437,228 | 198,437,228 |
| Discretionary | 154,056,090 |
812,562,203 | 966,618,293 |
| TOTAL | 155,416,943 |
1,072,209,983 |
1,227,626,926 |