

 �
�III. Achieving Permanency-Related Outcomes for Children in Foster Care
The Adoption and Safe Families Act (ASFA) of 1997 emphasized permanency as a primary goal for children in foster care and provided guidelines for achieving this goal in a timely manner. A key concern addressed by ASFA is that too many children "grow up" in foster care. That is, they spend too many of their formative years in a foster care placement rather than in a permanent home. Federal law and policy direct that, if it is necessary to remove children from their homes, concerted efforts must be made either to return them to their families quickly and safely or to quickly find another permanent home for them.
A child in foster care is determined to have achieved permanency when any of the following occurs: (1) the child is discharged from foster care to a reunification with his or her family, either a parent or other relative; (2) the child is discharged from foster care to a legally finalized adoption; or (3) the child is discharged from foster care to the care of a legal guardian. The Department established the following national outcomes and measures to assess State performance with regard to achieving permanency for children in foster care:
Outcome 3—Increase permanency for children in foster care
Outcome measure 3.1—Of all children who exited foster care during the reporting period, what percentage left either to reunification, adoption, or legal guardianship?
Outcome measure 3.2—Of all children who exited foster care and were identified as having a diagnosed disability, what percentage left either to reunification, adoption, or legal guardianship?
Outcome measure 3.3—Of all children who exited foster care and were older than age 12 at the time of their most recent entry into foster care, what percentage left either to reunification, adoption, or legal guardianship?
Outcome measure 3.4—Of all children who exited foster care to emancipation, what percentage was age 12 or younger at the time of entry into foster care?
Outcome measure 3.5—Of all children who exited foster care, what percentage by racial/ethnic category left either to reunification, adoption, or legal guardianship?
Outcome 4—Reduce time in foster care to reunification without increasing re-entry
Outcome measure 4.1—Of all children who were reunified with their parents or caretakers at the time of discharge from foster care, what percentage was reunified in the following time periods?
- (1) less than 12 months
- (2) at least 12 months but less than 24 months
- (3) at least 24 months but less than 36 months
- (4) at least 36 months but less than 48 months
- (5) 48 or more months
Outcome measure 4.2—Of all children who entered foster care during the reporting period, what percentage re-entered care:
- (1) within 12 months of a prior foster care episode?
- (2) 12 months or more after a prior foster care episode?
Outcome 5—Reduce time in foster care to adoption
Outcome measure 5.1—Of all children who exited foster care to a finalized adoption, what percentage exited care in the following time periods?
- (1) less than 12 months from the time of the latest removal from home
- (2) at least 12 months but less than 24 months
- (3) at least 24 months but less than 36 months
- (4) at least 36 months but less than 48 months
- (5) 48 or more months
The Department also adopted parts of outcome measures 4.1, 4.2, and 5.1 for the Child and Family Services Review (CFSR) and established national standards for these measures. The standards were used as part of the assessment of a State's substantial conformity with particular CFSR outcomes. (See appendices E and F for more information on the CFSR and the national standards.) The following are the measures and standards adopted for the CFSR:
- Of all children who were reunified with their parents or caretakers at the time of discharge from foster care, 76.2 percent or more were reunified in less than 12 months from the time of the latest removal from home (adopted from outcome measure 4.1).
- Of all children who entered foster care during the reporting period, 8.6 percent or less re-entered foster care within 12 months of a prior foster care episode (adopted from outcome measure 4.2).
- Of all children who exited foster care to a finalized adoption, 32 percent or more exited foster care in less than 24 months from the time of the latest removal from home (adopted from outcome measure 5.1).
This chapter provides the following information:
- State performance in 2003 on the permanency-related outcome measures.
- The change in State performance from 2000 to 2003 on select permanency-related outcome measures.
- The relationship between State performance in 2003 on permanency-related outcome measures and the number and characteristics of children in foster care.
The data reported in this chapter are from the Federal Adoption and Foster Care Analysis and Reporting System (AFCARS). AFCARS is the Department's national system for collecting, analyzing, and reporting data on children who are served by State and local foster care systems.15 The annual AFCARS report for 2003 is presented in appendix H.
The number of States varies for the findings presented in this chapter. States were excluded from an analysis if they did not report the necessary data or if there were substantial data quality issues in a given year, usually related to missing data or data discrepancies.16
Understanding State performance on the permanency-related outcome measures requires a consideration of State statutes, policies, and practices that may affect performance. For example, some States, by law, policy, or practice, require the child welfare agency to maintain its placement and care responsibilities for a period of time (usually between 3 to 6 months) after a child is physically reunified with his or her family. The fact that these children continue to be reported to AFCARS as being in foster care affects State performance on the outcome measure pertaining to time in foster care prior to reunification.
Because of the potential effect of State statutes and policies on performance on the outcome measures, the information regarding State performance in 2003 on the permanency-related outcome measures is provided to demonstrate the variation across States rather than to compare performance among States. Information regarding the change in performance from 2000 to 2003 is presented to depict the extent of change in performance for individual States.
State Performance in 2003 on Permanency-Related Outcome Measures
Achieving permanency
Outcome 3 (increase permanency for children in foster care) targets State performance in achieving permanency for children exiting foster care, with permanency defined as reunification (including living with relative), adoption, or legal guardianship. Under AFCARS, children exiting foster care who are not discharged to a permanent home may exit for the following reasons: (1) Emancipation; (2) Transfer to Other Agency, or (3) Death. The latter category is a fairly rare occurrence.
Table III-1 presents key findings with regard to State performance in 2003 on the permanency-related measures developed for outcome 3.
| Outcome Measures | Performance Variables | ||
|---|---|---|---|
| Range | Mean percent | Median percent | |
| Measure 3.1: Percent of all children exiting foster care who were discharged to a permanent home** (N=51 States) | 71.9-96.1% | 85.9% | 86.3% |
| Measure 3.2: Percent of all children with a diagnosed disability exiting foster care who were discharged to a permanent home (N=48 States) | 36.4-96.5 | 77.6 | 79.5 |
| Measure 3.3: Percent of all children exiting foster care who entered foster care when they were older than age 12 who were discharged to a permanent home (N=48 States) | 37.8-90.9 | 71.2 | 72.2 |
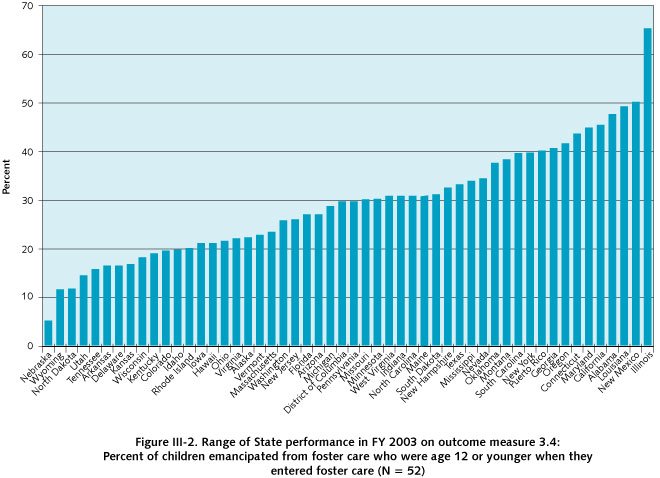
| Measure 3.4: Percent of all children who were emancipated from foster care who entered foster care when they were age 12 or younger (N=52 States) | 5.1-65.1 | 29.2 | 29.6 |
| Measure 3.5a: Percent of all White (non-Hispanic) children exiting foster care who were discharged to a permanent home (N=50 States)*** | 69.2-94.1 | 85.7 | 85.7 |
| Measure 3.5b: Percent of all Black (non-Hispanic) children exiting foster care who were discharged to a permanent home (N=36 States)*** | 68.1-94.9 | 84.4 | 85.6 |
| Measure 3.5c: Percent of all Hispanic children exiting foster care who were discharged to a permanent home (N=15 States)*** | 82.4-95.9 | 88.4 | 87.3 |
| Measure 3.5d: Percent of all Alaska Native/American Indian children exiting foster care who were discharged to a permanent home (N=7 States)*** | 69.0-92.4 | 80.7 | 82.0 |
|
* The number of States (N) varies because States were excluded if the reason for discharge was missing for at least 15 percent of the children exiting foster care. Back ** A discharge to a permanent home is a discharge to reunification (including living with relative), adoption, or guardianship. Back *** The number of States for this measure includes only those in which at least 10 percent of the exits from foster care were of the particular race/ethnicity identified in the measure—i.e., White (non-Hispanic), Black (non-Hispanic), Hispanic, or Alaska Native/American Indian. |
|||
As shown in table III-1, the median percentage across States for outcome measure 3.1 was 86.3, and the lowest percentage for any State was 71.9. Figure III-1 demonstrates the narrow range across States regarding performance on this measure (Mississippi is excluded from the figure).

These findings indicate that most children exiting foster care in 2003 were discharged to a permanent home. The discharge reason for most of these children was either adoption or reunification. There were only four States in which guardianship accounted for 10 percent or more of the exits to permanency (Arizona, Hawaii, Missouri, and North Carolina). In six States, no child was reported as discharged from foster care to guardianship (Alabama, New Jersey, New York, Puerto Rico, Texas, and Virginia).
The data in table III-1 also indicate that although States were generally effective in 2003 in achieving permanency for children exiting foster care, they were less effective in achieving permanency when the children exiting foster care had a diagnosed disability (outcome measures 3.2) or were older than age 12 when they entered foster care (outcome measure 3.3). The median percents for these measures are substantially lower than they are for outcome measure 3.1.
Figure III-2 depicts the range in State performance for outcome measure 3.4—the percentage of children who emancipated from foster care in 2003 and who entered foster care when they were age 12 or younger. For one-half of the States, at least 30 percent of the children emancipated from foster care were age 12 or younger when they entered foster care. In 10 States, more than 40 percent of the children exiting foster care due to emancipation were age 12 or younger when they entered foster care.
With respect to outcome measure 3.5 (discharges to permanency of children of different races/ ethnicity), for most States for which the analyses applied, there was little difference between the percentages of children of different races/ethnicity who were discharged to a permanent home in 2003.17 In these States, Black children, White children, Hispanic children, and Alaska Native/American Indian children exiting foster care were equally likely to exit to a permanent home. However, there were a few States in which achieving permanency appeared to vary as a function of the race/ethnicity of the child. These findings are presented below for the States included in the analyses.
- Exits to permanency for White (non-Hispanic) children compared to Black (non-Hispanic) children (N= 36 States). In seven of the 36 States, the percent of White (non-Hispanic) children exiting foster care who were discharged to a permanent home was at least five percentage points higher than the percent of Black (non-Hispanic) children exiting foster care who were discharged to a permanent home (Alabama, California, Illinois, Kentucky, Maryland, Pennsylvania, and Virginia).
- Exits to permanency for White (non-Hispanic) children compared to Hispanic children (N = 15 States). In one of the 15 States, the percent of White (non-Hispanic) children exiting foster care who were discharged to a permanent home was at least five percentage points higher than the percent of Hispanic children exiting foster care who were discharged to a permanent home (New York). In comparison, in two of the 15 States, the percent of White (non- Hispanic) children exiting foster care who were discharged to a permanent home was at least five percentage points lower than the percent of Hispanic children exiting foster care who were discharged to a permanent home (Nevada and Oregon).
- Exits to permanency of Alaska Native/American Indian children compared to White (non-Hispanic) children (N = 7 States). In two of the seven States, the percent of White (non-Hispanic) children exiting foster care who were discharged to a permanent home was considerably larger than the percent of Alaska Native/American Indian children exiting foster care who were discharged to a permanent home (in New Mexico, there was a difference of 22 percentage points; in Oklahoma, there was a difference of 11.5 percentage points).
- Exits to permanency of Black (non-Hispanic) children compared to Hispanic children (N=9 States). In two of the nine States, the percent of Hispanic children exiting foster care who were discharged to a permanent home was at least five percentage points higher than the percent of Black (non-Hispanic) children exiting foster care who were discharged to a permanent home (California and Nevada).
Achieving permanency in a timely manner
While outcome 3 assesses a State's effectiveness in achieving permanency for children in foster care, outcome 4 (Reduce time in foster care to reunification without increasing re-entry) and outcome 5 (Reduce time in foster care to adoption) assess a State's effectiveness in achieving permanency in a timely manner. Table III-2 presents State performance in 2003 on key measures relevant to these outcomes.
| Outcome Measures | Performance Variables | ||
|---|---|---|---|
| Range | Mean percent | Median percent | |
| Measure 4.1a: Percent of children discharged to reunification who were reunified within 12 months of entry into foster care (N=51 States) | 40.6-92.3% | 69.5% | 72.0% |
| Measure 4.1b: Percent of children discharged to reunification who were in foster care for at least 36 months before reunification (N=51 States) | 0.5-16.4 | 5.0 | 3.5 |
| Measure 4.2: Percent of children entering foster care who were re-entering within 12 months of a prior foster care episode (N=52 States) | 0.7-26.4 | 10.7 | 9.5 |
| Measure 5.1a: Percent of children discharged to adoption within 24 months of entry into foster care (N=47 States) | 5.0-75.8 | 27.2 | 23.9 |
| Measure 5.1b: Percent of children discharged to adoption who were in foster care for at least 48 months before the adoption (N=47 States) | 3.2-65.6 | 25.8 | 21.9 |
|
* The number of States (N) included in the analyses for each measure varies because States were excluded if at least 15 percent of the exits from foster care did not have a discharge reason or if there were other substantive data quality issues. Back |
|||
Figure III-3 depicts the range in State performance in 2003 for the percentage of reunifications occurring within 12 months of a child's entry into foster care (outcome measure 4.1). The figure does not include Mississippi. In five States, less than 50 percent of the reunifications occurred within 12 months of entry into foster care (Kansas, Maine, Maryland, Michigan, and Nebraska). In contrast, in five States, 85 percent or more of the reunifications occurred within 12 months of a child's entry into foster care (Arizona, Arkansas, Delaware, Minnesota, and New Mexico).


The data in table III-2 also indicate that the vast majority of children who exited foster care to reunification were in foster care for less than 36 months. There were only five States in which more than 10 percent of the children discharged to reunification were in foster care for at least 36 months prior to the reunification (District of Columbia, Illinois, Maryland, Nebraska, and New York).
Figure III-4 demonstrates the variation in State performance in 2003 concerning the percentage of children entering foster care who were re-entering within 12 months of a prior episode. At the low end, there were eight States in which less than 5 percent of the children entering foster care were re-entering within 12 months of a prior episode (Kansas, Maine, Michigan, Nevada, North Carolina, Puerto Rico, Texas, and Wyoming). At the high end, in six States, at least 20 percent of the children entering foster care were re-entering within 12 months of a prior episode (Delaware, Iowa, Minnesota, Pennsylvania, Rhode Island, and Wisconsin).
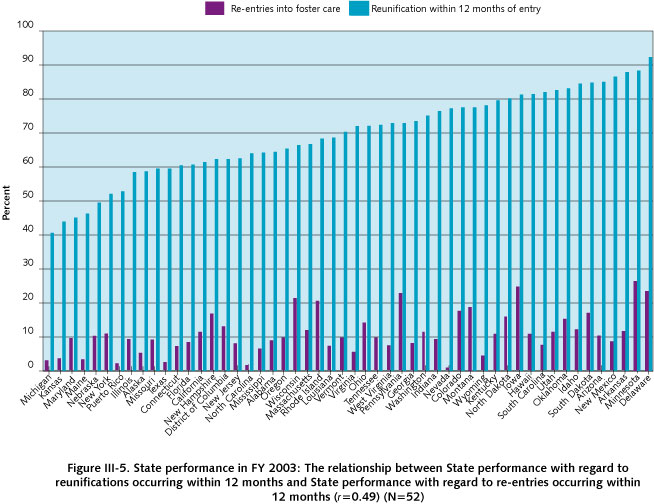
A key finding regarding State performance in 2003 on outcome 4 (Reduce time in foster care to reunification without increasing re-entry) is that States with a relatively high percentage of children entering foster care who were re-entering within 12 months of a prior episode (measure 4.2) also tended to have a relatively high percentage of reunifications occurring within 12 months of a child's entry into foster care (measure 4.1) (Pearson's r = 0.49). This relationship is depicted in figure III-5.
The range in State performance in 2003 concerning the percent of adoptions occurring within 24 months of a child's entry into foster care is presented in figure III-6. The figure does not include the States of Maine, Mississippi, North Dakota, Puerto Rico, and Wisconsin. In four States, more than 50 percent of the children adopted had been in foster care for less than 24 months (Colorado, Iowa, Rhode Island, and Utah).

In comparison, in six States, less than 15 percent of the children adopted in 2003 had been in foster care for less than 24 months (Connecticut, District of Columbia, Illinois, New York, Oregon, and Tennessee).
A key finding regarding State performance in 2003 with regard to outcome 5 (Reduce time in foster care to adoption) was that States that had a relatively high percentage of children adopted within 24 months of entry into foster care tended to have a relatively low percentage of children adopted who were in foster care for at least 48 months (Pearson's r = -0.79). This relationship is depicted in figure III-7. Because the measure specifies two other possible time frames for an adoption to occur, i.e., (1) in at least 24 months but less than 36 months, and (2) in at least 36 months, but less than 48 months, an increase in adoptions within 24 months will not result automatically in a decrease in adoptions within 48 months. In fact, as shown by the correlation, in several States, this relationship did not occur.

Change in State Performance from 2000 to 2003 on the Permanency-Related Outcome Measures
Changes in State performance were assessed by calculating the percent change from 2000 to 2003.18 If the percent change resulting from the calculation was less than 5.0 in either direction (i.e., positive or negative), a determination was made of "no change" in performance.
Table III-3 presents findings regarding the change in State performance from 2000 to 2003 on key measures pertaining to achieving permanency for children in foster care. The analyses included only those States that provided data for a measure in both years. Because of the wording of the outcome measures, for measures 3.1, 3.2, 3.3, 4.1 and 5.1, a positive percent change reflects an improvement in performance. In contrast, for measures 3.4 and 4.2, a positive percent change reflects a decline in performance.
| Outcome Measures | Change in Performance from 2000 to 2003 | ||
|---|---|---|---|
| Improved performance (number and percent of States) | Declined performance (number and percent of States) | No change in performance (number and percent of States) | |
| Measure 3.1: Percent of all children exiting foster care who were discharged to a permanent home (N=43 States) | 11 (26%) | 3 (7%) | 29 (67%) |
| Measure 3.2: Percent of all children with a diagnosed disability exiting foster care who were discharged to a permanent home (N=37 States) | 9 (24%) | 15 (41%) | 13 (35%) |
| Measure 3.3: Percent of all children who entered foster care when they were older than age 12 who were discharged to a permanent home (N=39 States) | 12 (31%) | 8 (21%) | 19 (49%) |
| Measure 3.4: Percent of all children emancipated from foster care who entered foster care when they were age 12 or younger (N=47 States) | 16 (34%) | 24 (51%) | 7 (15%) |
| Measure 4.1: Percent of all children discharged to reunification who were reunified within 12 months of entry into foster care (N=43 States) | 14 (32%) | 8 (19%) | 21 (49%) |
| Measure 4.2: Percent of all children entering foster care who were re-entering within 12 months of a prior foster care episode (N=46 States) | 17 (37%) | 18 (39%) | 11 (24%) |
| Measure 5.1: Percent of all children discharged to adoption who were adopted within 24 months of entry into foster care (N=34 States) | 24 (70%) | 6 (18%) | 4 (12%) |
|
* States were excluded if there were substantial data quality issues in either 2000 or 2003. Back |
|||
The following are noteworthy findings pertaining to a change in performance relevant to outcome 3—increase permanency for children in foster care:
- For 67 percent of the States, there was "no change" from 2000 to 2003 in the percentage of children exiting foster care who were discharged to a permanent home (outcome measure 3.1). This is not unexpected because most States performed at a very high level on this measure in 2000.
- For 49 percent of the States, there was no change in the percentage of children discharged to a permanent home who were older than age 12 when they entered foster care (outcome measure 3.3).
- For 41 percent of the States, there was a decline in performance regarding the percentage of children with a diagnosed disability who were discharged to a permanent home (outcome measure 3.2).
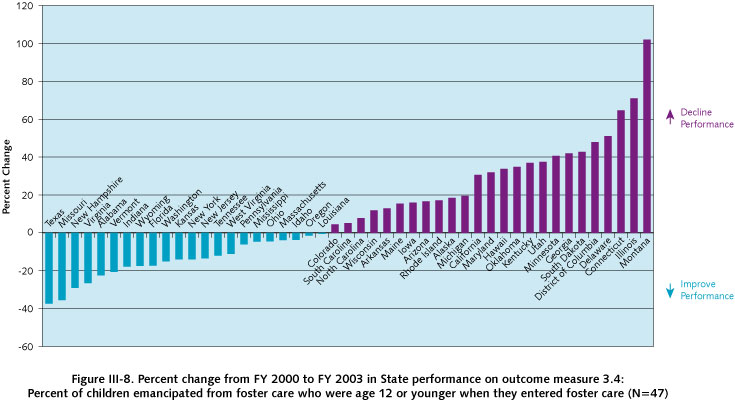
- For 51 percent of the States, there was a decline in performance regarding the percentage of children emancipated from foster care who were age 12 or younger when they entered foster care (outcome measure 3.4). The data presented in figure III-8 indicate that performance decline (represented by a positive percent change) on this measure was extensive for several States. Figure III-8 does not include Nebraska, Nevada, New Mexico, North Dakota, and Puerto Rico.
Key findings pertaining to a change in performance with regard to outcome 4 (reduce time in foster care to reunification without increasing re-entry) and outcome 5 (reduce time in foster care to adoption) are presented below:
- Most of the 47 States included in the analysis of change in performance on outcome measure 4.1 either improved performance on the percentage of reunifications occurring within 12 months of a child's entry into foster care (32 percent) or did not change in their performance on this measure (49 percent); only 19 percent of the States exhibited a decline in performance on this measure. Figure III-9 demonstrates the extent of change on this measure. The figure does not include Alaska, Maine, Massachusetts, Mississippi, Nebraska, Nevada, Texas, West Virginia, or Puerto Rico.


- For 39 percent of the 46 States included in the analysis of change in performance on outcome measure 4.2, there was a decline in performance regarding the percentage of children entering foster care who were re-entering within 12 months of a prior episode. Figure III-10 depicts the extent of change on this measure. This figure excludes the District of Columbia, Mississippi, Nebraska, Nevada, West Virginia, and Puerto Rico.
- For 70 percent of the 34 States included in the analysis of change in performance on outcome measure 5.1, there was an improvement in performance on the measure of adoptions occurring within 24 months of a child's entry into foster care. As shown in figure III-11, for many of these States, the extent of improvement was substantial. This figure excludes Alabama, Arkansas, Colorado, District of Columbia, Kansas, Maine, Massachusetts, Michigan, Mississippi, Nebraska, Nevada, New Mexico, Puerto Rico, Rhode Island, South Dakota, Texas, West Virginia, and Wisconsin. The majority of exclusions are due to data quality issues in 2000.

Relationships Between State Performance on Permanency-Related Outcome Measures and the Number and Characteristics of State Foster Care Populations
The following sections present findings pertaining to the relationships between State performance on the permanency-related outcome measures and the following:
- Foster care entry rate
- Age of children at entry into foster care
- Race/ethnicity of children in foster care
Foster care entry rate
A State's foster care entry rate is represented by the number of children entering foster care per 1,000 children in the State's population. In 2003, the foster care entry rate ranged from 1.7 in Illinois to 7.6 in Wyoming, with a median of 4.2. There were no substantive relationships (i.e., correlations of 0.40 or higher) between a State's foster care entry rate and performance on the permanency-related outcome measures.
Characteristics of the foster care population
Table III-4 presents information pertaining to the age of children at entry into foster care and the race/ethnicity of children in foster care in 2003. As shown in the table, the characteristics of foster care populations varied across States.
| Child Characteristics | Percent range across States | Median percent across States |
|---|---|---|
| Age of Children at Entry into Foster Care | ||
| Birth to age 5 | 22.2 - 57.8 % | 40.6 % |
| Age 6 to 12 | 16.3 - 36.8 | 28.3 |
| Age 13 to 15 | 10.8 - 36.7 | 19.6 |
| Age 16 and older | 3.4 - 33.0 | 9.7 |
| Children's race/ethnicity | ||
| Alaska Native/American Indian | 0 - 63.7 | 0.5 |
| Asian | 0 - 14.3 | 0.3 |
| Native Hawaiian/Other Pacific Islander | 0 - 29.2 | 0.1 |
| Black (non-Hispanic) | 0.2 - 85.1 | 22.6 |
| Hispanic (of any race) | 0.7 - 99.1 | 5.8 |
| White (non-Hispanic) | 0.2 - 96.2 | 47.0 |
| Multiple Races | 0.2 - 36.3 | 2.5 |
The following are key findings regarding the relationships between the characteristics of the foster care population and State performance on the permanency-related outcome measures.
- States with a relatively high percentage of children entering foster care at age 5 or younger tended to have a relatively low percentage of children entering foster care who were re-entering within 12 months of a prior episode (Pearson's r = -0.46).
- States with a relatively high percentage of children entering foster care at age 16 and older tended to have a relatively high percentage of children entering foster care who were re-entering within 12 months of a prior episode (Pearson's r = 0.52).
- States with a relatively high percentage of Black (non-Hispanic) children entering foster care tended to have a relatively low percentage of adoptions within 24 months (Pearson's r = -0.47).
The analyses of the race/ethnicity data of children in foster care found that in 2003, the percentage of children who are Black (non-Hispanic), Hispanic, or Alaska Native/American Indian exceeded the percentage of those children in a State's child population in many States. In contrast, the percentage of children in foster care who are White (non-Hispanic) was less than the percentage of these children in the State population. Table III-5 presents these findings.
| Relationship** | Race/Ethnicity of Children | |||
|---|---|---|---|---|
| Hispanic | White | Black | Alaska Native/ American Indian |
|
| Number and percent of States in which the percent of children in foster care exceeded the percent of children in the State's child population. | 14 (27%) | 0 | 50 (98%) | 21 (41%) |
| Number and percent of States in which the percent of children in foster care was about equal to the percent of children in the State's child population. | 23 (46%) | 34 (67%) | 1 (2%) | 13 (26%) |
| Number and percent of States in which the percent of children in foster care was less than the percent of children in the State's population. | 14 (27%) | 17 (33%) | 0 | 17 (33%) |
| Total | 51 (100%) | 51 (100%) | 51 (100%) | 51 (100%) |
|
* These data are not available for Puerto Rico. Back ** The following approach was used to determine the nature of the relationship: A determination of "exceeded" was made if the percent of children entering foster care of a particular race/ethnicity was at least 1.3 times the percent in the State's child population. A determination of "less than" was made if the percent of children entering foster care of a particular race/ethnicity was less than 0.7 times the percent in the State's child population. Back |
||||
In many States, the percentage of children of a particular race/ethnicity in foster care was considerably larger than the percentage of those children in the State's child population. Examples of this are provided below:
- The percent of Hispanic children in foster care was at least twice as large as the percent of Hispanic children in the State's child population in seven States (Connecticut, Maine, Massachusetts, Montana, New Hampshire, North Dakota, and South Dakota).
- The percent of Black children in foster care was at least three times larger than the percent of Black children in the State's child population in 22 States (California, Connecticut, Idaho, Illinois, Indiana, Iowa, Kansas, Michigan, Minnesota, Montana, Nebraska, Nevada, New Hampshire, New Jersey, New Mexico, Ohio, Oregon, Pennsylvania, Utah, Washington, Wisconsin, and Wyoming).
- The percent of Black children in the foster care population was at least four times larger than the percent of Black children in the State child population in seven States (California, Iowa, Minnesota, New Hampshire, New Jersey, Utah, and Wisconsin).
- The percent of Alaska Native/American Indian children in foster care was at least three times larger than the percent of these children in the State's child population in 11 States (Alaska, Idaho, Iowa, Minnesota, Montana, Nebraska, North Dakota, Oregon, South Dakota, Utah, and Washington).
- The percent of Alaska Native/American Indian children in foster care was at least five times greater than the percent of these children in the State's child population in six States (Idaho, Iowa, Minnesota, Nebraska, Oregon, and Washington).
15 The term "foster care" as it is used in the Report to Congress refers to a variety of out-of-home placement settings, including foster family homes, group homes, shelters, residential treatment facilities, and similar placements for children who are in the State's placement and care responsibility for a period of 24 hours or more. Back
16 States were excluded from several analyses if 15 percent or more of the exits from foster care did not have "reason for discharge" information. States also were excluded from the analysis of performance regarding the timeliness of adoptions (outcome measure 5.1) if there was a substantial discrepancy between the number of finalized adoptions submitted to the AFCARS Adoption file and the number of children reported to the AFCARS foster care file as exiting foster care with a discharge reason of adoption. Back
17 Comparisons with regard to exits to permanency for children of different races/ethnicity included only those States in which at least 10 percent of the exits from foster care were children of a particular race/ethnicity. As a result, comparisons involving Asian or Native Hawaiian/Other Pacific Islander children were not possible because there was only one State in which at least 10 percent of the exiting population were in either of those groups. Back
18 Change in performance across years was assessed by calculating the percent change. This is calculated by subtracting "old" data from "new" data, dividing by "old" data and multiplying by 100. Therefore, if reunification within 12 months was 67 percent in 2000, and 73 percent in 2003, the percent change would be: 73 (new 2003 measure) - 67 (old 2000 measure) /67 (old 2000 measure) times 100 (for percent) = +8.96 percent change. Back
| << Chapter II | Chapter IV >> |