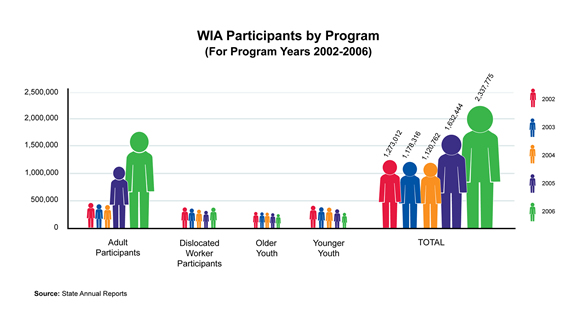
The number of individuals served by each of the WIA programs (Adults, Dislocated Workers, Older Youth and Younger Youth) decreased from Program Year (PY) 2002 to PY 2003. In PY 2002, the WIA programs served 1,273,012 people. This figure decreased to 1,178,316 in PY 2003, and further declined to 1,120,762 in PY 2004, and then rose to 1,632,444 in PY 2005. There was a further increase to 2,337,775 in PY 2006. The number of Adult participants rose in PY 2005 and 2006. The number of Dislocated Worker participants rose in PY 2006. The Older Youth and Younger Youth programs experienced a decline during each program year covered by this chart. The Adult program accounted for most of the total increase, and the increase may be attributed to some states including counts of participants who access self-service only.