 |
 |

|
Print  Download Reader
|
|
|
Print Download Reader
Performance and Accountability Report
|
|||||||||||||||||||||||||||||||||||||||||||||||||||||||||||||||||||||||||||||||||||||||||||||||||||||||||||||||||||||||||||||||||||||||||||||||||||||||||||||||||||||||||||||||||||||||||||||||||||||||||||||||||||||||||||||||||||||||||||||||||||||||||||||||||||||||||||||||||||||||||||||||||||||||||||||||||||||||||||||||
OPDIV and Program |
Measure |
FY |
Target |
Result |
Goal Met |
|---|---|---|---|---|---|
CDC |
1a. Achieve or sustain immunization coverage of at least 90% in children 19- to 35-months of age for: |
2004 |
90% coverage |
DTaP 86%; |
|
CDC |
1b1. Reduce the number of HIV infection cases diagnosed each year among people under 25 years of age. |
2004 |
Overall: 1900 reported cases in 25 areas |
New measures in FY 2004. |
N/A |
CDC |
1b2. Decrease the number of perinatally acquired AIDS cases from the 1998 base of 235 cases. |
2003 |
<139 cases |
58 cases |
√ |
SAMHSA |
1c. Number of clients served |
|
|
|
National Immunization Program (CDC): Vaccines are one of the most successful and cost-effective public health tools for preventing disease and death. In the United States and globally, CDC is engaged in a variety of efforts to ensure all recommended immunizations are provided safely and effectively to children, adolescents, and adults. Through the National Immunization Program, CDC has worked to achieve or sustain immunization coverage of at least 90 percent of children 19- to 35 months of age. In FY 2004, CDC achieved the 90 percent target for most vaccines, except for varicella and Diphtheria-Tetanus-Pertussis (DTaP).
In 2004, the coverage rate for four doses of DTaP did not achieve the 90 percent goal. While the administration of the first three doses of DTaP coincides with regular well-baby visits, the fourth dose does not. As such, there are fewer incentives to come in for the fourth dose. Moreover, in 2002 and 2003, CDC modified reporting on the measure for DTaP from four doses to three doses because vaccine shortages limited the availability of the fourth dose to children. This change was made because the Advisory Committee on Immunization Practices recommends that if this vaccine is in short supply, or not available, the fourth dose of DTaP may be dropped. The first three doses are considered the most critical to prevent disease. The change was temporary and reporting for the fourth dose has now been implemented.
HIV/AIDS Prevention (CDC): CDC will continue efforts to prevent and control the spread of HIV infections in the United States by engaging in surveillance, research, intervention, capacity building, and evaluation activities. Through the CDC’s domestic HIV prevention activities, CDC will work to reduce the major threats to the health and well-being of Americans from HIV/AIDS. This goal has two measures: (1) Reduce the number of HIV infection cases diagnosed each year among people less than 25 years of age, and (2) Decrease the number of perinatally-acquired AIDS cases from the 1998 base of 235 cases. With respect to the first measure, 2,926 cases were reported in 25 areas in FY 2002 and 2,331 cases were reported in 25 reporting areas in FY 2003. The results for the 2004 target of reducing the number of HIV infection cases diagnosed each year among people less than 25 years of age to 1900 cases in 25 areas are expected in November 2005. In prior years, performance information for this measure had to be updated as data was finalized.
Decreasing perinatal HIV transmission is one of four strategies included in CDC’s advancing HIV Prevention Initiative. Data for 2003 show low levels of perinatally-acquired AIDS cases, from 90 in 2002 to 58 in 2003. The results for the 2004 target of less than a 100 cases of perinatally-acquired AIDS will be available in November 2005. It is expected that the results will indicate a continued trend of decreasing the number of perinatally-acquired AIDS cases diagnosed. A policy change was made to change date for reporting results from August 2005 to November 2005 to allow for complete collection and analysis of data.
SAMHSA’s Substance Abuse Prevention and Treatment Block Grant Program works to improve the well-being of Americans by bringing effective alcohol and drug treatment and prevention services to every community through a block grant to states. In FY 2001 1,739,796 clients were served, in FY 2002 1,882,584 clients were served, and in FY 2003 1,840,275 clients were served. Data from SAMHSA’s Treatment Episode Data set, representing admissions to treatment, not the total number of individual clients served, are used as a proxy for this measure. FY 2003 is the most recent year for which data are currently available, because of the time required for states to report data on the number of admissions in any given year. The target was met for 2001 and 2002 but missed for 2003 (FY 2003 target was 1,884,654). SAMHSA is examining the reasons for the missed target.
HHS has a number of initiatives and programs directed at protecting Americans from bioterrorist attacks and other public health challenges. The events of September 11, 2001, and subsequent anthrax attacks have reinforced the lead role HHS plays in protecting Americans from attacks on the Nation’s health and food supply. HHS role in enhancing the Nation’s level of preparedness and overall response capabilities is absolutely vital to helping maintain America’s vigilance and security.
OPDIV and Program |
Measure |
FY |
Target |
Result |
Goal |
|---|---|---|---|---|---|
FDA |
2a. Perform prior notice import security reviews on food and animal feed line entries considered to be at risk for bioterrorism and/or present the potential of a significant health risk. |
2005 |
38,000 |
86,187 |
√ |
HRSA |
2b. Percent of awardees that have developed plans to address surge capacity. |
2005 |
100% |
100% |
√ |
CDC |
2c1. 100 percent of State public health agencies improve their capacity to respond to exposure to chemicals or category A agents by annually exercising scalable plans and implementing corrective action plans to minimize any gaps identified. |
2005 |
25% |
New measure in FY 2005. |
N/A |
CDC |
2c2. 100 percent of State public health agencies are prepared to use materiel contained in the Strategic National Stockpile as demonstrated by evaluation of standard functions as determined by CDC. |
2004 |
60% certified |
72% certified |
√ |
Field Foods Activities (FDA): The FDA continues to improve the Nation’s health care system to respond to bioterrorism and other public health challenges by ensuring the safety of foods, drugs, biological products, and medical devices, and by providing timely medical products to deal with emerging public health and terror threats. In FY 2005, the FDA supported the goal of ensuring food safety by surpassing its target of prior notice security reviews for foods and animal feeds line entries considered to be at risk for bioterrorism and that presented the potential of a significant health risk. In FY 2005, FDA with the help of Department of Homeland Security has completed 86,187 such reviews, exceeding its target of 38,000. There were over 53,000 more reviews in 2005 than 2004. However, it should be noted that FDA is not able to know in advance how many of the prior notices submitted will need to have a security review due to continuing changes in the criteria (intelligence and others) that must be met for determining when a security review is required. This information is tracked and verified through a variety of sources including the Operational and Administrative System Import Support. In addition, there is no trend information available as this measure is the result of the Bioterrorism Act which became effective in December of 2003.
HRSA's Bioterrorism Hospital Preparedness program is designed to enable State and regional planning among local hospitals, emergency medical services systems, health centers, poison control centers, and other health care facilities to improve their preparedness to work together to combat terrorist attacks and deal with infectious disease epidemics and other public health emergencies. HRSA met its FY 2005 target of 100 percent of Hospital Preparedness program awardees having surge capacity plans. This represents an increase from 89 percent in FY 2004.
Terrorism Preparedness (CDC): The CDC’s terrorism efforts are a critical element in the drive to protect the American public from a terrorist attack. Many of CDC’s programs are interconnected and strive to provide the best possible coverage and results under the unifying goal of protecting the population. One such program is the Strategic National Stockpile, which is designed to supplement local efforts by reaching and providing advanced treatment to areas affected by a terrorist attack or mass trauma event. One target is for 70 percent of state public health agencies to be prepared to use Stockpile materials in 2005. The data for this measure is expected to be available in December of 2005. In 2004, the target of 60 percent was exceeded. Another target for measuring emergency preparedness in 2005 is for 25 percent of state public health agencies improve their capacity to respond to chemicals or category A agents. This data will be available in December 2005. This is a new measure; there is no 2004 data for this measure.
Strategic Goal 3
Increase the Percentage of the Nation’s Children and Adults Who Have Access to Health Care Services, and Expand Consumer Choices
HHS is working to expand health care to all and remains committed to its many efforts aimed at increasing the percentage of the Nation's children and adults who have access to care and expanding consumer choices. The Department also will continue to promote increased access to health care for uninsured and underserved people and for those whose health care needs are not adequately met by the private health care system. In support of this goal, HHS will continue to promote a wide variety of activities intended to increase access to health care; encourage the development of low-cost health insurance options; reduce health disparities; and strengthen and improve health care services for targeted populations with special health care needs.
OPDIV and Program |
Measure |
FY |
Target |
Result |
Goal |
|---|---|---|---|---|---|
HRSA |
3a1. Increase the infrastructure of the Health Center program to support an increase in utilization via new or expanded sites. |
2005 |
153 |
158 |
√ |
HRSA |
3a2. Increase the number of uninsured and underserved persons served by Health Centers. |
2004 |
13.2 million |
13.13 million |
|
HRSA |
3a3. Continue to assure access to preventive and primary care for racial/ethnic minorities. |
2004 |
8.58 million (65%) |
8.3 million (64%) |
|
IHS |
3b. By 2010 increase the percentage of patients with ideal glycemic control to 40%. |
2004 |
33% |
34% |
√ |
CMS |
3c1. Decrease the number of uninsured children by working with states to enroll children in SCHIP and Medicaid |
2004 |
Maintain enrollment at FY 2003 levels. |
Goal met. |
√ |
CMS |
3c2a. Improve health care quality across Medicaid and SCHIP Improve Health Care Quality Across Medicaid |
2005 |
Refine the strategy and work plan for the provision of technical assistance to states in performance measurement calculation and reporting; collect 2002 performance measurement data from a minimum of 10 states; and continue to provide technical assistance to improve state capability for performance measurement calculation and reporting, and to encourage voluntary reporting by additional states. |
Goal met. |
√ |
CMS |
3c2b. Improve health care quality across Medicaid and SCHIP Improve Health Care Quality Across SCHIP |
2005 |
Continue to collect core performance measurement data from states through the state annual reports; use the new automated State Annual Report Template System to analyze and evaluate performance data; and provide technical assistance to states on establishing baselines, measurement methodologies, and targets for SCHIP core measures. |
Goal met. |
√ |
CMS |
3d1. Implement the new Medicare-Endorsed prescription drug card |
2005 |
Continue providing information to people with Medicare about the program through written materials, the www.medicare.gov website, and 1-800-MEDICARE. |
Goal met. |
√ |
CMS |
3d2. Improve satisfaction of Medicare beneficiaries with the health care services They receive. Managed Care: Fee For Service: |
2004 |
Monitor annual data toward 5-year target |
Goal met |
√ |
CMS |
3e. Protect the health of Medicare beneficiaries age 65 years and older by increasing the percentage of those who receive an annual vaccination for influenza and a lifetime vaccination for pneumococcal |
2003 |
Flu: 72.5% |
Flu: 70.4% Influenza vaccine shortages and distribution delays in |
HRSA's Health Centers program provides regular access to high quality, family-oriented, and comprehensive primary and preventive health care, regardless of patients’ ability to pay. In 2004, the Health Centers program served 13.13 million persons, up from 12.39 million in 2003. While the program did not meet the target of 13.2 million persons served, the actual number served is extremely close to meeting the projected target based on the program’s projections on resources needed per patient. This represents a growth of more than 700,000 persons over FY 2003 and an increase of nearly 3 million persons since the beginning of the President’s initiative in FY 2002. In FY 2005, HRSA aimed to provide health services to 14 million persons. FY 2005 data are expected in August 2006.
The IHS National Diabetes program is an integral part of the IHS Hospitals and Health Clinics program. The ongoing emphasis on diabetes care within IHS programs recognizes the role of diabetes as a major cofactor in morbidity and mortality among American Indian/Alaska Native people. Maintaining ideal blood glucose levels is vital for diabetic patients in delaying or preventing many of the complications associated with diabetes, including cardiovascular, kidney, and eye disease. To achieve improvements in glycemic control, IHS combines glucose-lowering medications with a continued emphasis on proper diet and exercise. From FY 2002 to FY 2005, IHS achieved a 4 percent increase in diabetic patients demonstrating ideal blood sugar control (from 30 to 34 percent). CMS is committed to its goal of assessing health care quality for children enrolled in Medicaid and SCHIP. Through the use of a core set of national performance measures developed in partnership with states, CMS continues to meet yearly targets related to this goal. For several years, CMS has collected voluntary performance measurement data from states and continues to provide technical assistance to improve State capability for performance measurement calculation and reporting. These data provide CMS and States with the tools to evaluate performance of those states voluntarily submitting data. The collection of this data helps states to gain insight into their current status, from which they can set goals for the future. These data are reported by states on a voluntary basis. In FY 2003, CMS partially met its target to identify a timeline for implementing recommendations for Medicaid; identify a strategy for improving health care delivery and quality, and specify measures for gauging improving and initiate action steps for implementing recommendations for Medicaid and SCHIP. In FY 2004, CMS continued to work with state representatives and updated the timeline for implementing recommendations and identified a strategy for improving health care delivery and quality and for implementing recommendations. In FY 2005, CMS met its target to refine the strategy and work plan for the provision of technical assistance to states in performance measurement calculation and reporting.
For SCHIP, CMS met its FY 2003 target to identify a timeline for implementing recommendations; its FY 2004 target to refine the data submission, methodological processes, and reporting; and its FY 2005 goal to continue to collect core performance measurement data from states through the state annual reports.
CMS has published final program regulations and will establish a major initiative to educate health care providers and consumers about the Medicare Prescription Drug, Improvement, and Modernization Act (MMA). The MMA, signed into law by the President in early FY 2004, provides enhanced coverage for the lowest income beneficiaries and an immediate prescription drug discount card for all beneficiaries who choose to obtain such a card until the full drug benefit is available nationwide. CMS plans to continue to provide information to all beneficiaries about the drug card program through written materials, the www.medicare.gov website, and 1-800-MEDICARE. CMS monitors the information needs of people with Medicare about the program. For example, the questions that come into the 1-800-MEDICARE call center are reviewed to ensure that the customer service representatives have the information needed to answer specific questions. When additional information needs are identified, CMS will modify print materials and the website as needed.
Strategic Goal 4
Enhance the Capacity and Productivity of the Nation’s Health Science Research Enterprise
HHS recognizes the important role research plays in improving the Nation's health. As a result, many of the strategies that HHS has identified as important components in achieving its other strategic goals also incorporate a research base. This goal, therefore, focuses on creating the underlying knowledge and strategies that improve and maintain the research infrastructure that produces advances in health science.
HHS is committed to advancing the understanding of the environmental factors that contribute to human disease. In order to accomplish this objective, HHS will continue to support basic, clinical, and applied biomedical and behavioral research with stringent peer review for scientific quality of research proposals. HHS will also develop and implement processes for setting research priorities that ensure that research is responsive to public health needs, scientific opportunities, and advances in technology. HHS places a high priority on improving the coordination, communication, and application of health research results.
OPDIV and Program |
Measure |
FY |
Target |
Result |
Goal |
|---|---|---|---|---|---|
NIH |
4a. By 2005, create the next generation map of the human genome, a so-called haplotype map (HapMap), by identifying the patterns of genetic variation across all human chromosomes. |
2005 |
Develop a first-pass draft HapMap containing 600,000 single nucleotide polymorphisms (SNPs). |
Completed first-pass draft HapMap with 1.007 million single nucleotide polymorphisms. Begun in FY 2003, the target for this measure has been met or exceeded each year. |
√ |
NIH |
4b. By 2012, develop a knowledge base on chemical effects in biological systems using a systems toxicology or toxicogenomics approach. |
2005 |
Create and provide public access to a global molecular expression and toxicology/pathology database of environmental chemicals and drugs (CEBS), featuring simple query download capability. |
CEBS (version 1.5) has been made available to the public. This program provides simple query download capability of global molecular expression and toxicology/pathology data on a select number of studies of environmental chemicals and drugs. Begun in 2003, CEBS has attained its annual targets each year including 2005. |
√ |
NIH completed a first-pass draft HapMap containing 1.007 million single nucleotide polymorphisms or SNPs. Phase II, to be released in October 2005 , will contain about 3.6 million SNPs. The NIH significantly exceeded its target of releasing a HapMap containing 600,000 SNPs, and met or exceeded its annual targets. This information can be verified using the SNP Database.
NIH is in the process of establishing a knowledge base on the effects of chemicals and drugs in biological systems in order to better understand the role of gene-environment interactions in disease. In FY 2005, NIH met its annual target of creating and providing public access to a global molecular expression and toxicology/pathology by making its database of environmental chemicals and drugs (CEBS), featuring simple query download capability, available to the public. In future years, NIH has set a target of enhancing the CEBS database to add and integrate data on transcriptomics, proteomics, and toxicology for the same chemical compound. In the long term, this data is expected to lead to the discovery of characteristic gene- and protein-expression signatures that will help classify exposure to these chemicals by their biological activity, and provide a means for predicting effects on human health from such exposure. This measure has met it annual targets since its inception in 2003. Data for this system can be validated at CEBS website at http://cebs.niehs.nih.gov.
Strategic Goal 5
Improve the Quality of Health care Services
Improving the quality of life in the United States includes improving the quality of the health care services that people receive. This strategic goal is to improve health care services by reducing medical errors, improving consumer and patient information, and accelerating the development and use of electronic health information.
To achieve this goal, HHS will continue the implementation of a variety of strategies designed to improve the delivery of health care services. These strategies include the development and dissemination of evidence-based practices, information systems, new technologies for the home and clinical setting, and improved reporting systems for medical errors and adverse events. Health quality improvement also means translating new knowledge of effective health services into strategies, educational tools, and information to help clinicians and health care policy makers improve health care quality. HHS will work to expand provider networks to disseminate health care quality information, enabling consumers to make informed choices. HHS will provide leadership to promote the development of a national health information infrastructure that takes advantage of the most current technology available.
OPDIV and Program |
Measure |
FY |
Target |
Result |
Goal Met |
|---|---|---|---|---|---|
FDA |
5a. Expand the implementation of the MedSun System to a network of 350 facilities. |
2005 |
350 facilities |
354 facilities |
√ |
AHRQ |
5b1. Increase the quality and quantity of preventive services that are delivered in the clinical setting especially focusing on priority populations. |
2005 |
Establish baseline quality and quantity of preventative services delivered. |
Baselines: |
√ |
AHRQ |
5b2. Increase the number of partnerships that will adopt and promote evidence-based clinical prevention. |
2005 |
Establish baseline of partnerships within the Prevention Portfolio promoting clinical prevention. |
Federal partners: 8 |
√ |
FDA MedSun: continues to improve the quality of health care services by reducing medical errors involving FDA-regulated products. FDA also strives to improve patient and consumer safety by increasing the use of health care quality information, strengthening consumer and patient protections, and monitoring the safety of FDA-related products already on the market. In FY 2005 the Medical Products Surveillance Network for medical devices (MedSun), supported this goal by exceeding its target of bringing 350 facilities into the MedSun network by four facilities. MedSun has met or exceeded its targets each year since 2002. This information can be validated by the FDA and the contractor responsible for managing the MedSun system.
Current chronic diseases such as cancer, diabetes, heart disease, and stroke are among the most common and costly of all health problems, yet they are among the most preventable4 . A critical step in reducing the burden caused by chronic disease is improving the quality of clinical services that prevent those diseases. Thus the Agency for Healthcare Research and Quality plays a key role in improving quality of care through activities accomplished within the Prevention Portfolio.
In FY 2005, AHRQ met its targets for both measures: 1) Establishing baselines for the quality and quantity of preventive services delivered; and 2) Forming partnerships with both Federal and non-Federal organizations. The portfolio now has baselines for clinical services delivered for Pap smear (81.3 percent), flexible sigmoidoscopy/colonoscopy (38.9percent), fecal occult blood test (33 percent), blood pressure measurement (90.1 percent), cholesterol measurement (67.0 percent), and smokers receiving advice to quit smoking (60.9 percent). These measurements were verified using the National Healthcare Quality Report, National Health Interview Survey and the Medical Expenditure Panel Survey. The Prevention Portfolio now has baseline measure of partners - 8 federal partners and 19 non-federal partners. A count of active partnerships is provided by outside contractors through stakeholder meeting, expert panel meetings and groups with clinicians. Since the both targets were established in FY 2005, no trend data is available.
Strategic Goal 6
Improve the Economic and Social Well-being of Individuals, Families, and Communities, Especially Those Most in Need
HHS promotes and supports interventions that help disadvantaged and distressed individuals, families, and communities improve their economic and social well-being. To achieve this strategic goal, HHS supports targeted efforts to increase the independence and stability of low-income families, people with disabilities, older Americans, American Indians/Alaska Natives, victims of domestic violence, refugees, and distressed communities.
OPDIV and Program |
Measure |
FY |
Target |
Result |
Goal |
|---|---|---|---|---|---|
ACF |
6a. Increase (from FY 2000) the percentage of adult TANF recipients/former recipients employed in one quarter of the year that were still employed in the next two consecutive quarters. |
2003 |
68% |
59% |
|
AoA |
6b1. (Targeting) Increase the number of severely disabled clients who receive selected home and community-based services. |
2004 |
New in 2004 |
293,500 |
N/A |
AoA |
6b2. (Client Outcomes) Increase the percentage of caregivers reporting that services have definitely helped them provide care longer for older individuals. |
2004 |
New in FY 2004 |
52% |
N/A |
The purpose of Temporary Assistance for Needy Families (TANF) is to increase the self-sufficiency and stability of low-income families by promoting employment and job readiness as well as activities that support healthy marriages. Welfare reform has been largely successful in increasing the financial independence of recipients since the Personal Responsibility and Work Opportunity Reconciliation Act passed in 1996. In March 2005, there were 63 percent fewer individuals receiving TANF benefits than in August 1996.
TANF has several work-related measures, including job entry, job retention, and earnings gain. The program has made progress in each of these areas, but did not meet some of the FY 2003 targets because of the unanticipated effects of the caseload reduction credit in reducing the recipient work participation rates. For example, the job retention rate measures the percentage of current or former TANF recipients who are employed in one quarter of the year and remain employed in the next two quarters. In FY 2003, the job retention rate was 59 percent, missing the original 68 percent target. Since then, the program has revised its performance targets to reflect the effects of the caseload reduction credit. Also, as welfare recipients continue to move from welfare to work, the President's TANF reauthorization proposal emphasizes the continued importance of strengthening work participation and achievement of TANF recipients.
AoA’s Aging Services program provides a comprehensive set of services to elderly individuals and family caregivers that help keep America’s rapidly growing older population healthy, secure and independent in the community. These services are especially important as part of a community-based long-term care system designed to give the elderly choice and control and delay institutionalization. Program performance measures included in this report reflect the importance AoA places on rebalancing the Nation’s long-term care system toward more home and community-based care. For the first performance measure 6b1: Increase the number of severely disabled clients receiving selected (home-delivered meals) home and community-based services, AoA collected baseline data in FY 2003. At baseline, there were 280,454 severely disabled home-delivered meal clients. In FY 2004, there were 293,500 severely disabled home-delivered meal clients, over a 4 percent increase. The FY 2005 performance target is 302,000. AoA anticipates achieving this target. For the second performance measure 6b2: Increase the percentage of caregivers reporting that services have definitely helped them provide care longer for older individuals, AoA collected baseline date in FY 2003. At baseline, 48 percent of caregivers reported that services definitely helped them provide care longer. In FY 2004, 52 percent reported that services definitely helped. The FY 2005 performance target is an ambitious 62 percent. Two years of data shows improved program performance for both measures.
Strategic Goal 7
Improve the Stability and Healthy Development of Our Nation’s Children and Youth
In order to promote the development and stability of our nation's children and youth, HHS will continue moving forward with several important efforts. HHS will continue to support the social and cognitive development of preschool children; provide supports for family formation and healthy marriages; support programs that increase the involvement and financial support of non-custodial parents; and increase the percentage of children and youth living in a safe and stable environment.
OPDIV and Program |
Measure |
FY |
Target |
Result |
Goal |
|---|---|---|---|---|---|
ACF |
7a. Increase the Title IV-D collection rate for current support. |
2003 |
58% |
58% |
√ |
ACF |
7b. Increase the number of adoptions. |
2003 |
58,500 |
50,0005 |
|
ACF |
7c. Achieve goal of at least 80 percent of children completing the Head Start program rated by parent as being in excellent or very good health. 6 |
2002 |
80% |
79% |
ACF Child Support Enforcement: The mission of Child Support Enforcement (CSE) is to ensure that children receive the financial and medical support they need by locating parents, establishing paternity, and enforcing support obligations. Child support is an important source of income to improve the quality of life for children and for families striving for self-sufficiency. In FY 2003, the CSE program met its target of collecting 58 percent of current support due (collections on current support/current support owed). Current support collections totaled $15.7 billion in FY 2003, an increase of approximately 4 percent over the previous fiscal year. In fact, the CSE program has met or exceeded its target for current support collections in every year since 2001, collecting 58 percent in 2002 and 57 percent in 2001. Data for FY 2005, which increases the target current support collection rate to 61 percent, is not yet available.
CSE is largely dependent on state administrative systems for collecting performance data. In terms of data quality and reliability, states maintain information on the necessary data elements for CSE program measures. The Office of CSE reviews the states’ and auditors’ ability to produce valid data. Data reliability audits are conducted annually. Self-evaluation by states and the Office of CSE audits provide an ongoing review of the validity of the data and the ability of automated systems to produce accurate data.
ACF Child welfare programs, like Foster Care, Promoting Safe and Stable Families, and Adoption Incentives, provide an array of services to children in at-risk families or children who need to be removed from the home. ACF is dedicated to protecting children, reunifying families when possible, and finding safe and stable permanent homes for children who cannot return to their families. In FY 2003 ACF finalized adoptions for 50,000 children from the child welfare system, but missed the goal of 58,500 adoptions. The goal of 58,500 adoptions in FY2003 was not met for a variety of complex reasons, including the decline in the number of children in foster care; the increase in age of the children entering care and waiting to be adopted; the increase in the percentage of children with a case plan goal of reunification; and the decline in the percentage of children with a case plan goal of adoption. To meet their adoption goals, the Children's Bureau is implementing a major effort to recruit adoptive families called "AdoptusKids." In addition, the Children's Bureau will continue to use the Child and Families Services Reviews (CFSR) to work with states to improve their child welfare systems. In FY 2002, there were 53,000 adoptions; 50,000 in FY 2001; and 51,000 in FY 2000. State child welfare agencies report data on foster care and adoption through the Adoption and Foster Care Analysis and Reporting System; system data is subject to edit checks for reliability.
ACF's Head Start program promotes school readiness by enhancing the social and cognitive development of low-income children through the provision of educational, health, nutritional, social, and other services. During FY 2002, the most recent period for which data are available, 79 percent of children completing the Head Start program were rated by their parent as being in excellent or very good health. This is within 1 percentage point of meeting the target for this measure. A likely contributor to this shortfall is the persistent difficulty low-income families face in gaining timely access to needed health care, with particular problems in receiving oral health care. To address this need, the Head Start Bureau has implemented, in partnership with HRSA’s Maternal and Child Health Bureau, an Oral Health Initiative which since 2004 has supported a national network of technical assistance designed to improve Head Start children's access to oral health care. With this resource focused on improved oral health care access, and its continued attention to the overall health of Head Start children, Head Start expects to reach the 80 percent target. The FY 2002 result represents an improvement from 77 percent in FY 2000.
Strategic Goal 8
Achieve Excellence in Management Practices
HHS is committed to improving the efficiency and effectiveness of the Department's programs by creating an organization that has a citizen-based focus, is results-oriented, and is market-driven, where practicable. The President's Management Agenda identifies key elements needed for HHS to achieve its commitment to establishing more effective Department management. In particular, HHS is dedicated to improving management of its financial resources; using competition to obtain the best price for services acquired; improving the management of its human capital and tying human capital goals to program performance goals; using technology wisely and in a cost effective manner; and achieving an integrated performance budget.
OPDIV and Program |
Measure |
FY |
Target |
Result |
Goal |
|---|---|---|---|---|---|
CMS |
8a. Reduce the percentage of improper payments made under the Medicare Fee-For-Service program |
2005 |
7.90% |
5.20% |
√ |
Office of Inspector General |
8b. Returns per budget dollar invested in the Office of Inspector General |
2005 |
$176 |
$168 |
CMS will continue its focus on maintaining program integrity in the Medicare program to ensure that it pays the right amount to legitimate providers for covered, reasonable, and necessary services to eligible beneficiaries. CMS sets ambitious annual program integrity targets, including reducing the percentage of improper payments made under the Medicare fee-for-service program, as well as reducing the contractor error rate and improving the provider compliance error rate. The Comprehensive Error Rate Testing (CERT) program, initiated in FY 2003, has produced a national error rate for each year since its inception. The Office of Inspector General produced error rate information for years before those included in the FY 2003 report. In 2004, CMS began reporting gross error rates in addition to the net error rates previously reported. This change was necessary in order to comply with new Improper Payments Information Act requirements. As a transition, the FY 2004 reports will contain both net and gross numbers. A gross improper payment amount is calculated by adding underpayments to overpayments. A net improper payment amount is calculated by subtracting underpayments from overpayments. Future reports will contain only gross numbers.
The FY 2005 paid claims error rate of 5.2 percent exceeded CMS' Medicare Fee for Service Error Rate GPRA goal of 7.9 percent. Because of this dramatic improvement, CMS has chosen to revise its GPRA goals for 2006 and beyond. The FY 2004 Medicare error rate was 10.1 7 percent, FY 2003 was 5.8 8 percent and FY 2002 was 6.3 percent. The FY 2004 error rate is the baseline for future error rate estimates reflecting the CERT program. CMS did not meet its FY 2004 target error rate of 4.8 percent. The original target error rates were developed based upon the assumption that the CERT program would discover similar findings in its reports as the Office of Inspector General. However, the numbers reported did not align with the target assumptions; therefore CMS has revised its baseline target data to reflect CERT data. CMS and the CERT contractors audit the data through ongoing quality control measures that include comparison of the number of claims in the CERT universe (i.e., all claims Medicare contractors receive) to an independent CMS report of the number of claims Medicare contractors received and verification that paid amounts for sampled claims match independent CMS records of claims payments.
The Office of Inspector General (OIG) will continue to combat fraud, waste, and abuse, and recommend ways of increasing the economy, efficiency, and effectiveness of HHS programs and management practices. To accomplish this, the OIG will conduct and supervise audits, inspections, and investigations; and provide guidance to the health care industry.
Return on investment (ROI) has long been the primary measure of the effectiveness and efficiency of the OIG. It is the ratio of savings that would not have been possible in the absence of effective OIG work to the OIG operating budget. The savings that are claimed by the OIG consist of expected recoveries from investigations, audit disallowances, and savings from legislative and administrative changes that were stimulated by recommendations in OIG reports. The source data used for these results are the following: expected recoveries from investigations are entered into the OIG investigations data system “IRIS.” Documents that officially report the conclusion of criminal and civil proceedings, including the amount of fines, penalties, and restitution must be received by the OIG before the expected recoveries are allowed into the IRIS system. Audit disallowances are entered into the OIG WEB AIMS system by the Audit Resolution staff of the HHS Office of the Assistant Secretary for Budget Technology and Finance, and are reconciled to the OIG audit disallowance issuances. Savings from legislative and administrative changes are those scored and published by the Congressional Budget Office as part of the legislative process. All of the above are subject to periodic audit by the Government Accountability Office (GAO).
In 2002, the target for ROI was $79:1, but the final result was $121:1. The ROI target has risen each year, and in FY 2005 was $176:1. The FY 2002 result was $121:1. There was a decrease in FY 2003 to $117:1, but that result exceeded the $114:1 target. FY 2004 exceeded the previous year's results by 28% and the target for that year by 10 percent. The ROI target has risen each year, and in FY 2005 was $176:1. The FY 2005 result was $168:1 - an increase of 12% over FY 2004, but 5 percent below the target. Since the results of OIG work are not realized during the same year in which resources related to the results are expended - often requiring five or more years to be realized - it is inevitable that an increase in resources in any given year will impact ROI negatively. The results of OIG work often require five or more years to be realized because they are not realized during the same year in which resources related to the results are expended. Therefore, it is inevitable that an increase in resources in any given year will impact ROI negatively. In most years, the impact is not sufficient to result in an ROI that misses its target, but that did occur in FY 2005 when nearly $11 million was added to the OIG budget for the purpose of carrying out mandates contained in the MMA. If the MMA supplement were excluded from the ROI calculation, OIG FY 2005 ROI would have been $177:1, which exceeded the $176:1 target. With or without the MMA supplement, the result continued the OIG record of returns that far exceed its cost of operation.
What the PMA Scores Indicate |
||
Score |
Status |
Progress |
|
Agency meets all of the Standards for Success. |
Implementation is proceeding according to plans agreed upon with agencies. |
|
Agency has achieved intermediate levels of performance in all criteria. |
Some slippage or other issues requiring adjustment by the agency in order to achieve initiative objectives on a timely basis. |
|
Agency has any one of a number of serious flaws. |
Initiative in serious jeopardy. Unlikely to realize objectives absent significant management intervention. |
The President’s Management Agenda (PMA) articulates the Administration’s strategy for improving the management and performance of government. It established goals for five government-wide initiatives (Strategic Management of Human Capital, Competitive Sourcing, Improved Financial Performance, Expanded Electronic Government, and Budget and Performance Integration) and several program-specific initiatives. As a result, agencies develop and implement action plans to achieve those goals. The Office of Management and Budget (OMB) uses PMA scorecards to hold agencies publicly accountable for their status in achieving the goals of each initiative and for their progress in implementing their action plans. Agencies also use these scorecards as blueprints for improvement efforts. The scorecards, which are released quarterly, employ a simple grading system of green for success, yellow for mixed results, and red for unsatisfactory.

* As of September 30, 2005.
The following table shows HHS status and progress on both the five government-wide initiatives that apply to all Federal agencies and the five program initiatives that impact HHS programs and operations: Broadening Health Insurance Coverage, Faith-Based and Community Initiative, Real Property Asset Management, Research and Development (R&D) Investment Criteria, and Eliminating Improper Payments. As of September 30, 2005, HHS earned three green status scores and nine of ten green progress scores.
The following tables discuss HHS' efforts during FY 2005 to further the PMA and action plans to promote progress in FY 2006.
|
|||
|
Overview The Strategic Management of Human Capital initiative intends to build, sustain, and effectively deploy a skilled, knowledgeable, diverse, and high-performing workforce to meet current and emerging needs, and align strategies with organizational mission, vision, core values, goals, and objectives. People are the single most significant resource available to HHS leadership. To support the PMA, the Department is building a fully integrated human capital management approach that bridges the gap between where HHS is today and where HHS needs to be in the future. HHS has become a better-managed organization that is leveraging its human capital, systematically measuring its performance, remaining focused on its mission, and anticipating and responding to future requirements. |
|||
FY 2005 Accomplishments
|
|||
FY 2006 Action Plan
|
| |||
Overview The Competitive Sourcing initiative aims to achieve efficient and effective competition between public and private sources by simplifying and improving the procedures for evaluating public and private sources, better publicizing the activities subject to competition, and ensuring senior-level agency attention to the promotion of competition. For competitive sourcing, HHS is at the forefront of civilian agencies. For example, HHS was one of the first Federal agencies to develop and implement a long-range competitive sourcing plan (known as a Green Plan), consistent with the revised OMB Circular A-76, Performance of Commercial Activities. The Department also supports a fair and reasoned approach to competitive sourcing and encourages input from competitive sourcing programs across HHS OPDIVs. |
|||
FY 2005 Accomplishments
|
|||
FY 2006 Action Plan
|
|
|||
Overview The Expanded Electronic Government initiative aims to leverage the use of information technology (IT) to significantly improve the government's ability to serve citizens, reduce the costs of delivering those services, and ensure electronic transactions are private and secure. HHS continues to make significant progress in expanding the use of electronic government (e-Gov) to conduct Departmental business and to serve citizens more effectively and efficiently, while helping to improve the delivery of its services to government, businesses, and the American people. HHS’ strategic planning and performance management efforts have aligned all major IT projects with HHS IT strategic planning goals and objectives and those, in turn, are aligned with the Departmental goals and objectives. |
|||
FY 2005 Accomplishments
|
|||
FY 2006 Action Plan
|
|
|||
Overview The Budget and Performance Integration initiative requires Federal agencies to use performance information to inform funding and management decisions and to improve program performance. The results will be a more effective and efficient Federal Government. |
|||
FY 2005 Accomplishments In FY 2005, HHS continued to successfully integrate performance information into budget and management decision processes at the Department, OPDIV, and program level. HHS’ success in budget and performance integration is highlighted below.
|
|||
FY 2006 Action Plan For FY 2006, HHS has identified the following priorities to focus efforts to achieve a green status rating for the Budget and Performance Integration initiative. The Department has adopted an aggressive strategy that will take time but will continue to produce results.
|
|
|||
Overview The Improved Financial Performance initiative requires Federal agencies to ensure financial systems produce accurate and timely information to support operating, budget, and policy decisions by improving timeliness, enhancing usefulness, and ensuring reliability by obtaining and sustaining clean audit opinions. The goals and initiatives in HHS’ Financial Management Five-Year Plan correlate with the key success elements articulated in the PMA. HHS’ overarching financial management goals seek to (1) provide decision makers with timely, accurate, and useful financial and program information; and (2) ensure that HHS resources are used appropriately, efficiently, and effectively. In correlation with the PMA, the plan’s focal points include, but are not limited to the results and timeliness of the annual financial statement audit, and the continued development and implementation of a Unified Financial Management System (UFMS). |
|||
FY 2005 Accomplishments
|
|||
FY 2006 Action Plan
|
|
|||
Overview Eliminating improper payments is central to the Administration’s efforts to improve financial performance government-wide, enhance the integrity of Federal programs, and ensure that limited resources are used for their intended purpose. In previous years, this area was included under the PMA initiative “Improved Financial Performance.” In FY 2005, this stand-alone scorecard initiative was created to increase attention to this critical area and to ensure that Federal agencies are held accountable for achieving results in its improper payment reduction efforts. HHS has always been committed to ensuring taxpayer resources are spent wisely. In FY 1996, HHS began measuring payment errors in one of its largest programs (Medicare fee-for-service). Since the enactment of the Improper Payments Information Act of 2002 (IPIA), HHS has determined methodologies for estimating payment errors in two other programs (Foster Care and Head Start), finalized a plan for estimating payment errors in a component of its second largest program (Medicaid), conducted risk assessments of its largest programs, implemented a recovery auditing program, and taken appropriate corrective action measures to reduce the extent of payment errors identified in HHS programs. Additional information on HHS’ improper payments activities can be found in Appendix C of this report. |
|||
FY 2005 Accomplishments
|
|||
FY 2006 Action Plan
|
|
|||
Overview The Broadening Health Insurance Coverage initiative aims to increase the number of individuals with access to affordable health insurance by increasing state flexibility to provide health insurance to low-income individuals while ensuring prudent management of Federal Medicaid and State Children’s Health Insurance Program (SCHIP) funds. The Medicaid Program provides healthcare to millions of low-income Americans who otherwise would lack health insurance coverage. In 2002, CMS first announced the Health Insurance Flexibility and Accountability (HIFA) demonstration initiative, which puts emphasis on broad statewide approaches that maximize private health insurance coverage options and target Medicaid and SCHIP resources to populations with incomes below 200 percent of the Federal poverty level. |
|||
FY 2005 Accomplishments
|
|||
FY 2006 Action Plan
|
|
|||
Overview The mission of the Faith-Based and Community initiative at HHS is to create an environment within the Department that welcomes the participation of faith-based and community organizations as valued and essential partners in helping Americans in need. Through the collaborative efforts of the Center for Faith-Based and Community Initiatives (CFBCI) and several OPDIVs, HHS has accomplished the following in outreach/technical assistance, pilot projects, data collection, and regulatory reform. |
|||
FY 2005 Accomplishments
|
|||
FY 2006 Action Plan
|
|
|||
Overview The Real Property Asset Management initiative aims to improve asset management and rightsize inventory. The Department is currently developing and implementing a number of tools to achieve these goals, including an HHS Real Property Asset Management Plan (RAMP), Automated Real Property Inventory System and government-wide performance measures, consistent with Federal Real Property Council (FRPC) guidance, and HHS-specific performance measures used in the daily management of the HHS Real Property Asset Management Program. These tools are also expected to aid HHS in real property management by fostering mission success through occupant productivity and efficiency, and maintaining appropriate stewardship of real property. Key components of the Department’s approach to fulfill these goals include acquiring a comprehensive understanding of current HHS asset management procedures, leveraging Departmental work groups, identifying Federal/private sector best practices, and obtaining contractor assistance. |
|||
FY 2005 Accomplishments
|
|||
FY 2006 Action Plan
|
|
|||
Overview The Research and Development (R&D) investment Criteria initiative requires Federal agencies to develop objective investment criteria for Federal research and development projects that will better focus the government’s research programs on performance. HHS continues its commitment to ensuring that its investments in R&D are effective and yield new knowledge for the development of diagnostics, treatments, and preventive measures to improve health and quality of life for all Americans. Central to the development and implementation of objectives under the Department’s strategic goal 4, “Enhance the capacity and productivity of the Nation’s health science research enterprise,” are the OMB R&D investment criteria: relevance, quality, and performance. These criteria are considered carefully as research goals and associated targets are developed, as management changes are considered, and as HHS and its OPDIVs make budget decisions. |
|||
FY 2005 Accomplishments
|
|||
FY 2006 Action Plan
|
For the seventh consecutive year HHS received a clean audit opinion on its financial statements. The financial statements have been prepared in accordance with Federal accounting standards and audited by the independent accounting firm of Ernst & Young, LLP. Preparation and audit of these statements is required by the Chief Financial Officers Act of 1990 and is part of the Department’s goal to improve financial management and to produce accurate and reliable information that is useful in assessing performance and allocating resources.
The following table summarizes HHS’ financial condition at the end of FY 2005 (dollars in millions).
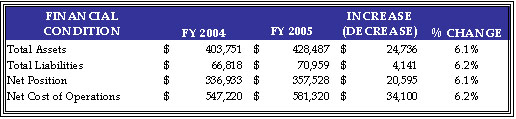
Assets
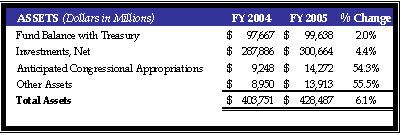
HHS assets were $428 billion at the end of FY 2005. This represents an increase of $25 billion, or 6.1 percent over the prior year’s assets totaling $404 billion. This variance is largely attributable to increases in Investments, Anticipated Congressional Appropriations, and Other Assets. The Investments increase was related primarily to growth in the Medicare trust fund for Hospital Insurance (HI). The majority of the Anticipated Congressional Appropriations increase was related to the rise in Medicaid funding to cover the unfunded portion of the Incurred But Not Reported. The increase in Other Assets was due primarily to prepaid expense payments to health maintenance organizations.
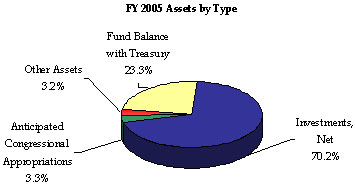
Investments and Fund Balance with Treasury together comprise 93.4 percent of total assets, while Anticipated Congressional Appropriations account for 3.3 percent. Other assets of 3.2 percent consist of Accounts Receivable; Loans Receivable; Cash and Other Monetary Assets; Inventory and Related Property; General Property, Plant, and Equipment; and Other Assets.
Medicare Trust Funds
At the end of FY 2005, approximately $298 billion or 99.3 percent of HHS investments were in U.S. Treasury securities to support the Medicare trust funds, which include HI and the Supplementary Medical Insurance (SMI) trust funds. Established in 1965 as Title XVIII of the Social Security Act, Medicare was legislated as a complement to Social Security retirement, survivors, and disability benefits, and originally covered people age 65 and over. In 1972, the program was expanded to cover the disabled, people with end-stage renal disease requiring dialysis or kidney transplant, and people age 65 or older who elect Medicare coverage. Medicare is a combination of three programs: HI, SMI, and Medicare Advantage. Since 1966, Medicare enrollment has increased from 19 million to approximately 42 million beneficiaries.
Hospital Insurance
What the HI Program Pays For
Hospital
Skilled Nursing Facility
Home Health
Hospice Care
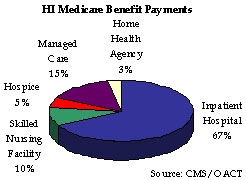
HI or Medicare Part A, usually is provided automatically to people age 65 and over who have worked long enough to qualify for Social Security benefits and to most disabled people entitled to Social Security or Railroad Retirement benefits. The HI Program pays for hospital, skilled nursing facility, home health, and hospice care and is financed primarily by payroll taxes paid by workers and employers. The taxes paid each year are used mainly to pay benefits for current beneficiaries. Funds not currently needed to pay benefits and related expenses are held in the HI trust fund, and invested in U.S. Treasury securities. As reported in the Required Supplementary Stewardship Information section of this report, HI trust fund assets steadily increase through 2011. At that point, expenditures start to exceed income including interest, thus drawing down assets until 2020 when they would be depleted. The shortfall between income and expenditures arises as a result of health costs increases that are expected to continue to grow faster than workers’ earnings. Actual economic or other conditions, however, could delay or accelerate this condition. Based on estimates from the Mid-Session Review of the FY 2005 President’s Budget, inpatient hospital spending accounted for 67 percent of HI benefit outlays. Managed Care spending comprised 15 percent of total HI outlays. During FY 2005, HI benefit outlays grew by 9.4 percent. The HI benefit outlays per enrollee are projected to increase by 7.8 percent to $4,300.
Supplementary Medical Insurance
What the SMI Program Pays For
Physician Outpatient Hospital
Laboratory Tests Home Health
Durable Medical Equipment Designated Therapy
Medicare Prescription Drug Discount Enrollment Fees and
Prescription Drug Expenses for Transitional Assistance Beneficiaries
Other Services Not Covered by HI
SMI, or Medicare Part B and Medicare Part D, is available to nearly all people age 65 and over, the disabled, and people with end stage renal disease who are entitled to Part A benefits. The SMI Program pays for physician, outpatient hospital, home health, laboratory tests, durable medical equipment, designated therapy, Medicare prescription drug discount card enrollment fees and prescription drug expenses for Transitional Assistance beneficiaries, and other services not covered by HI. The SMI coverage is optional and beneficiaries are subject to monthly premium payments. About 94 percent of HI enrollees elect to enroll in SMI.
 Whereas HI is funded primarily by payroll taxes, SMI obtains its funding through monthly beneficiary premiums and income from the general fund of the U.S. Treasury - both of which are established annually to cover the following year’s expenditures. Thus, the SMI trust fund is in financial balance every year, regardless of future economic and other conditions, due to its financing mechanism.
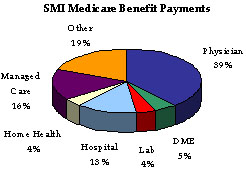
Funds not currently needed to pay benefits and related expenses are held in the SMI trust fund, and invested in U.S. Treasury securities. Under the Trustees’ intermediate set of assumptions, the HI trust fund will incur an actuarial deficit of nearly $8.6 trillion over the 75-year projection period, as compared to about $8.2 trillion in the 2004 financial report. In order to bring the HI trust fund into actuarial balance over the next 75 years, very substantial increases in revenues and/or reductions in benefits would be required. Based on estimates, during FY 2005, SMI benefit outlays grew by 12 percent. Physician services, the largest component of SMI, accounted for 39 percent of SMI benefit outlays. The SMI benefit outlays per enrollee are projected to increase 10.2 percent to $3,730. It is important to note that no liability has been recognized on HHS’ balance sheet for future payments to be made to current and future program participants beyond the existing Incurred But Not Reported Medicare claim amounts as of September 30, 2005. This is because Medicare is accounted for as a social insurance program rather than a pension program. The Required Supplementary Stewardship Information within Section III of this report contains additional details of HHS’ social insurance funds and other stewardship property and investments.
Whereas HI is funded primarily by payroll taxes, SMI obtains its funding through monthly beneficiary premiums and income from the general fund of the U.S. Treasury - both of which are established annually to cover the following year’s expenditures. Thus, the SMI trust fund is in financial balance every year, regardless of future economic and other conditions, due to its financing mechanism.
Funds not currently needed to pay benefits and related expenses are held in the SMI trust fund, and invested in U.S. Treasury securities. Under the Trustees’ intermediate set of assumptions, the HI trust fund will incur an actuarial deficit of nearly $8.6 trillion over the 75-year projection period, as compared to about $8.2 trillion in the 2004 financial report. In order to bring the HI trust fund into actuarial balance over the next 75 years, very substantial increases in revenues and/or reductions in benefits would be required. Based on estimates, during FY 2005, SMI benefit outlays grew by 12 percent. Physician services, the largest component of SMI, accounted for 39 percent of SMI benefit outlays. The SMI benefit outlays per enrollee are projected to increase 10.2 percent to $3,730. It is important to note that no liability has been recognized on HHS’ balance sheet for future payments to be made to current and future program participants beyond the existing Incurred But Not Reported Medicare claim amounts as of September 30, 2005. This is because Medicare is accounted for as a social insurance program rather than a pension program. The Required Supplementary Stewardship Information within Section III of this report contains additional details of HHS’ social insurance funds and other stewardship property and investments.
Liabilities
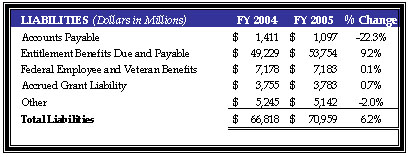
During FY 2005, HHS liabilities increased $4 billion or 6.2 percent to a total of $71 billion. This increase can be attributed primarily to a $5 billion or 9.2 percent increase to $54 billion in Entitlement Benefits Due and Payable, which represent benefits due and payable to the public from the CMS insurance programs discussed above, offset by a decrease of $314 million or 22.3 percent to Accounts Payable. The increase in Entitlement Benefits was due to increases in HI and SMI Incurred But Not Reported, HI and SMI payables to health maintenance organizations, and Medicaid Incurred But Not Reported. Accounts Payable decreased primarily due to a reduction of HI and SMI administrative cost payables.
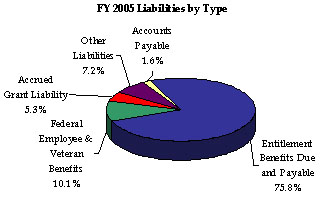
Entitlement Benefits and Federal Employee and Veteran Benefits account for 75.8 percent and 10.1 percent of total liabilities, respectively. Accrued Grant Liability accounts for 5.3 percent, while Accounts Payable comprises 1.6 percent. Other liabilities of 7.2 percent consist of Accrued Payroll and Benefits, Loan Guarantees, and Other Liabilities.
Ending Net Position
At the end of FY 2005, HHS’ Net Position was $358 billion, an increase of $21 billion or 6.1 percent from the previous year. HHS net position consists of the cumulative net results of operations since inception, and unexpended appropriations, or those appropriations provided to HHS that remain unused at the end of the fiscal year.
Results of Operations
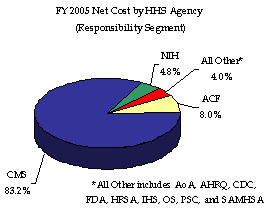
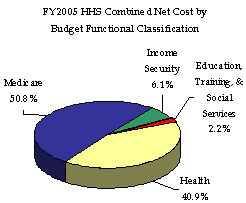
HHS incurred a Total Net Cost for the year of $581 billion, which represents a $34 billion or 6.2 percent increase over FY 2004. This increase resulted primarily from program growth experienced by the Medicare HI and SMI, Medicaid, and State Children’s Health Insurance Programs. The Consolidated Statement of Net Cost in Section III of this report presents HHS Net Operating Costs by HHS Agency (which comprise Departmental responsibility segments), while functional detail is provided in the footnotes to the financial statements, also in Section III. The CMS, ACF, and NIH account for a combined 96.0 percent of HHS’ total Net Cost of Operations, incurring net costs of $483 billion, $47 billion, and $28 billion, respectively. HHS incurs net costs across its primary functions as defined in the budget, and HHS’ Medicare (50.8 percent); Health (40.9 percent); Income Security (6.1 percent); and Education, Training, and Social Services (2.2 percent) account for all of HHS’ net costs incurred during FY 2005.
Cost vs. Outlays The following concepts are critical for understanding the HHS financial history:
- Costs are typically reported in accounting reports and are synonymous with expenses. These are the amounts recognized when services are rendered or goods are received. They are not necessarily linked to the outflow of cash in the form of check issuance, disbursements of cash, or electronic funds transfer.
- Costs incurred or expenses are netted against exchange or earned revenues to identify the net cost of programs.
- Outlays are payments to liquidate an obligation (other than the repayment of debt principal).
- Outlays generally are equal to cash disbursements, but also are recorded for cash-equivalent transactions.
Budgetary Resources
During FY 2005, most of the funding to support net costs came from $773 billion in appropriations from Congress, as shown in HHS’ Combined Statement of Budgetary Resources. This represents 94.9 percent of the gross budgetary resources available to HHS. This gross amount was offset by a pre-designated portion of funds that were either temporarily or permanently unavailable pursuant to specific legislation to derive a net funds available amount of $794 billion, an increase of 10.1 percent over FY 2004 levels. During FY 2005, HHS incurred obligations of $776 billion, a 10.5 percent increase over FY 2004, and made 7.0 percent more net outlays totaling $581 billion.
Limitations of the Principal Financial Statements
The principal financial statements in Section III of this report have been prepared to report the financial position and results of operations of HHS, pursuant to the requirements of 31 U.S.C. 3515 (b), the Chief Financial Officers Act of 1990, as amended by the Reports Consolidation Act of 2000 (P.L. 106-531). While the statements have been prepared from the books and records of HHS in accordance with generally accepted accounting principles (GAAP) for federal entities and the formats prescribed by OMB, the statements are in addition to the financial reports used to monitor and control budgetary resources, which are prepared from the same books and records. The statements should be read with the realization that they are for a component of the U.S. Government, a sovereign entity, and that the liabilities reported in the financial statements cannot be liquidated without legislation providing resources to do so.
Grants Management
As the largest grant-awarding agency in the Federal Government and the Nation’s largest health insurer, HHS plays a key role in Federal grants management. HHS manages an assortment of grant programs in basic and applied science, public health, income support, child development, and health and social services. Through these programs, HHS awarded an average of 74,000 grants totaling more than $230 billion annually between FYs 2001 and 2004. 9 These programs are the Department’s primary means to achieving its strategic goals.
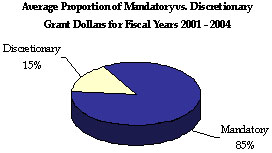
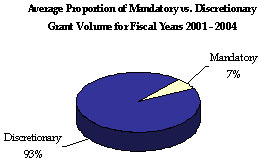
HHS awards two types of grants: mandatory and discretionary. Mandatory grants are those that a Federal agency is required by statute to award if the recipient, usually a state, submits an acceptable application and meets the eligibility and compliance requirements of the grant program’s statutory and regulatory provisions. Discretionary grants permit the Federal Government, according to specific legislation, to exercise judgment in selecting the project or proposal to be supported and selecting the recipient organization through a competitive process.
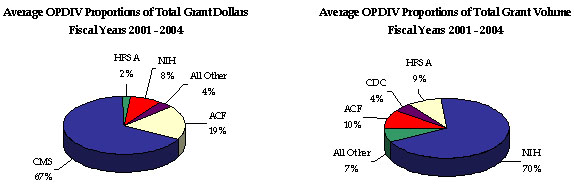
For FYs 2001 through 2004, most HHS-awarded grants were discretionary (93 percent of total grant volume awarded), yet most dollars associated with HHS grants were mandatory (85 percent of total dollars awarded). The NIH awards the majority (70 percent) of HHS’ total grants, but only 8 percent of total grant dollars, indicating a low dollar per grant ratio. Still, NIH grants annually account for the majority of total HHS discretionary dollars awarded. While ACF awards the greatest proportion of mandatory grants, CMS awards the majority of mandatory and total (67 percent) grant dollars, but only a small percentage of total grant volume, indicating a high dollar per grant ratio.
HHS grant program stewardship and oversight responsibilities involve a variety of ongoing administrative functions, including:
OMB designated HHS as the lead agency to manage the Federal Grant Streamlining program, a government-wide effort required by the Federal Financial Assistance Management Improvement Act (Public Law 106-107) of 1999. The program’s goal is to streamline, simplify, and provide electronic options for the grants management processes employed by Federal agencies and improve the delivery of services to the public. Program initiatives encompass the entire grant life cycle and include: standardizing, simplifying, and streamlining the formats used to provide program synopses; announcing funding opportunities; and publishing the forms required to apply for and report on grant funds. HHS is also the lead agency for government-wide Grants.gov, a PMA e-Gov initiative. HHS’ Grants.gov program office, in partnership with the 26 major grant-making agencies, is modifying and developing grants management practices and information systems that will allow current and prospective recipients of Federal grants to find, apply for, and manage grant funds online through a common website.
HHS also manages the Tracking Accountability in Government Grants System, which contains Department-wide grants award information. Current policies, regulations, and other pertinent grants-related information are available at http://taggs.hhs.gov.
Debt Collection Improvement Act
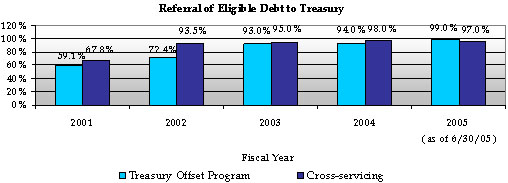
HHS manages its delinquent debt pursuant to the Debt Collection Improvement Act of 1996. Although HHS refers delinquent debt to the Department of the Treasury (Treasury) for cross-servicing and offset, HHS has centralized the delinquent debt referral process by establishing the Program Support Center (PSC) as the Department’s delinquent debt collection center. In addition, Treasury has granted a cross-servicing exemption for several types of program debts (e.g., Medicare Secondary Payer and various health professional loans). The PSC cross-services these debts and also refers them to the Treasury Offset Program.
According to the FY 2005 third quarter Treasury Report on Receivables, HHS and Treasury cooperative debt collection efforts have resulted in:
Prompt Payment Act
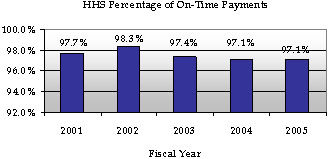
The Prompt Pay Act requires Federal agencies to make timely vendor payments and to pay interest penalties when payments are late. HHS reached a Department-wide record in FY 2002 by making over 98 percent of payments on time. Since then, HHS’ prompt pay rate has decreased slightly. HHS’ prompt pay rate for FY 2005 was 97.1 percent.
This section describes select systems that are critical to HHS Department-wide management, and discusses HHS’ capacity to comply with the Federal laws and regulations that pertain to those systems and controls over the Department’s resources. The systems discussion includes an overview of HHS’ current key systems and details on the Department’s future implementation of the Unified Financial Management System (UFMS). A cornerstone to improving HHS management practices is the Department’s ability to maintain management systems, processes, and controls that ensure financial accountability; provide useful management information; and meet requirements of Federal laws, regulations, and guidance. HHS seeks to comply with a variety of Federal financial management systems requirements, including those articulated by the Federal Managers’ Financial Integrity Act (FMFIA), the Chief Financial Officers Act, the Government Management Reform Act, the Clinger-Cohen Act of 1996, the Federal Financial Management Improvement Act (FFMIA), as well as OMB Circular A-127, Financial Management Systems.
HHS’ overall goals for its financial management systems focus on ensuring effective internal controls, timely and reliable financial and performance data for reporting, and system integration. The Department’s immediate priorities are to address the two weaknesses (as identified in its corrective action reports) in financial management system processes, and Medicare contractors’ electronic data processing (EDP) access controls.
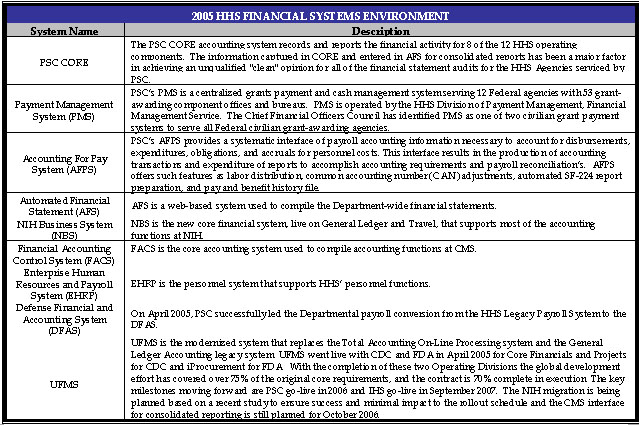
HHS Financial Management Systems
This table summarizes the existing key HHS systems that allow HHS Agencies to perform the majority of financial management business functions across the Department. HHS current financial systems environment consists of four core accounting systems including numerous feeder systems processing grants, travel, acquisitions, logistics, and other administrative systems.
HHS Financial Management System Weaknesses
Financial Management Systems Processes
HHS continues to have serious internal control weaknesses in its financial systems and processes for producing financial statements. HHS’ primary strategy to remedy this material weakness is the implementation of UFMS. UFMS is a business transformation effort designed to integrate Department-wide financial management systems and operations by aligning HHS’ businesses with modern technological capabilities. The existing HHS financial management system configuration supports standard data elements and interface records. With UFMS, HHS will also standardize business processes for all core functions including general ledger, accounts payable, accounts receivable, cost management, budget execution, and financial reporting. In the CDC and FDA implementations many processes were standardized, including shared interfaces, SGL, naming conventions, Accounts Payable and Accounts Receivable. The purpose of these initiatives is to implement an integrated procurement system across all OPDIVs in HHS in collaboration with the UFMS and the asset management system.
General and Application Controls
Electronic Data Processing (EDP) weaknesses were identified for Medicare contractors in five primary types of controls: entity-wide security programs, access controls (physical and logical), systems software, application software development and change controls, and service continuity. The CMS continues to make progress in identifying and addressing weaknesses in its automated processing systems. The first phase of Healthcare Integrated General Ledger Accounting System (HIGLAS) is to develop the financial accounting and businesses related to Medicare contractor’s claims payments. The next phase is to integrate all remaining Medicare Trust Funds, Medicaid, and administrative financial functionality. UFMS will contain a summary set of books, while HIGLAS would continue to process all of CMS core business program related activities and administrative processes. The first phase of HIGLAS is underway; the first implementation was Palmetto Part A, the next three implementations were Empire Part A, Empire Part B, and First Coast Part A and all four are now operating.
UFMS Implementation
The UFMS investment will replace five legacy accounting systems (PSC’s CORE Accounting System, CDC’s TOPS, FDA’s GLAS, NIH’s CAS, and CMS’ FACS) with a web-based, commercial, off-the-shelf product. Once fully implemented, UFMS will reduce the legacy systems to one modern accounting system, with two components: HIGLAS will support CMS and the Medicare contractors and the other will serve the rest of HHS.

UFMS will produce information that is timely, useful, and reliable and will support the integration of financial and performance information. UFMS will produce the information that program managers and decision makers will need in a timely manner and will provide the real-time processes needed to support effective e-Gov initiatives. Finally, the Secretary’s plans also will result in streamlining critical administrative systems that impact financial management functions, including grants and acquisition. In conjunction with these internal streamlining efforts, the Department will continue to ensure coordination with e-Gov initiatives efforts such as e-Travel, e-Payroll, e-Procurement, and Grants.gov.
HHS has ambitious implementation goals for UFMS. As currently structured, HHS is proceeding on three parallel tracks:
Details about the UFMS initiative can be obtained through the UFMS website at www.hhs.gov/ufms.
Payroll Conversion
PSC successfully led the Departmental payroll conversion from the HHS legacy Payroll System to the Defense Finance and Accounting System (DFAS). The payroll conversion took place on April 17, 2005 and is the single largest civilian agency payroll conversion ever completed by DFAS. The PSC was instrumental in the development of the new payroll interfaces and conversion files. PSC simultaneously kept the old payroll system and interfaces operational to ensure that more than 67,000 HHS employees continued to receive their pay.
Statement of Auditing Standards (SAS) 70 Systems Reviews
Independent examinations of HHS internal controls are completed annually under oversight of the HHS Office of Inspector General (OIG). The service auditors’ examinations for FY 2005 were completed under the guidelines of the American Institute for Certified Public Accountants (AICPA) Statement of Auditing Standards (SAS) Number 70, Service Organizations. The annual examination is a “Type 2” report providing an opinion on the internal controls placed in operation and includes tests of operating effectiveness. The following summarizes HHS systems findings during the FY 2005 examinations.
PSC: Division of Financial Operations - CORE Accounting System and Feeder Systems
An independent examination was conducted of the HHS controls for the Division of Financial Operations (DFO) general information technology and application controls over the CORE accounting system and feeder systems (i.e., Accounting for Pay System, Travel Management System, Managing and Accounting Credit Card System (MACCS), Accounts Receivable System, and the Debt Management Collection System). The DFO’s network infrastructure is operated by the Information Technology Service Center (ITSC). In the examiner’s opinion, the description of controls presents fairly, in all material respects, the relevant aspects of the DFO controls that have been placed in operation as of June 30, 2005.
In the examiner’s opinion, except for the following control objectives not being achieved: “Applications software development and change controls provide reasonable assurance that all programs and program modifications are properly authorized, tested, and approved and that access to and distribution of programs are carefully controlled; controls provide reasonable assurance that computer resources (data files, application programs, system software and computer-related facilities and equipment) are protected against unauthorized modification, disclosure, loss, or impairment; and controls provide reasonable assurance that changes to the existing systems software and implementation of new system software are authorized, tested, approved, properly implemented, and documented” ; the controls that were tested were operating with sufficient effectiveness to provide reasonable, but not absolute assurance that the control objectives were achieved during the period of July 1, 2004, to June 30, 2005.
PSC: Human Resources Service Personnel and Payroll Systems
An independent examination of HHS internal controls for the PSC examined the PSC general IT and application controls over the Human Resources Service personnel and payroll systems (i.e., Civilian Payroll System, EHRP, and the Commissioned Officer Personnel and Payroll System). In the examiner’s opinion, the controls that were tested were operating with sufficient effectiveness to provide reasonable, but not absolute, assurance that the control objectives were achieved during the period of July 1, 2004, to June 30, 2005 except for as noted below:
PSC: Division of Payment Management
An independent examination was conducted of HHS internal controls for the Division of Payment Management. In the examiner’s opinion, the controls that were tested were operating with sufficient effectiveness to provide reasonable, but not absolute, assurance that the control objectives were achieved during the period of July 1, 2004, to June 30, 2005. The controls identified were suitably designed to provide reasonable assurance that the specified control objectives were achieved and all Division of Payment Management controls were complied with satisfactorily.
NIH: Center for Information Technology
An independent examination was conducted of HHS internal controls for the NIH Center for Information Technology. In the examiner’s opinion, except for procedures for “System Software Implementation and Maintenance for the Windows Environment,” the controls that were tested were operating with sufficient effectiveness to provide reasonable, but not absolute, assurance that the control objectives were achieved during the period of July 1, 2004, to June 30, 2005.
Legal Compliance
FMFIA requires that agencies establish controls that reasonably ensure the integrity of Federal programs and the use of funds. FFMIA requires agencies to implement and maintain systems that comply with specific government-wide system parameters and policies. The Federal Information Security Management Act (FISMA) lays out a framework for annual information technology security reviews, reporting, and remediation planning to improve Federal agency internal controls over information resources and ensure compliance with laws and regulations regarding computer security. As noted in the assurance statements in the Secretary’s message at the beginning of this report, the following FMFIA, FFMIA, and FISMA issues remain outstanding at the end of FY 2005.
Federal Manager’s Financial Integrity Act
HHS reports one new Section 2 material weaknesses in 2005, Managed Care Benefit expense Cycle. Two Section 2 material weaknesses from the FY 2004 report - Federal Information Security Management Act (FISMA) Significant Deficiency, Departmental Financial Reporting - have been corrected as planned. For the Departmental Payroll System, the auditors found that substantial progress has been made and it is no longer material.
In addition, the Department reported one repeat material nonconformance, Department-wide Financial Systems and Processes. For one of the two subcomponents of this material nonconformance -- Financial Systems Analysis and Oversight -- CMS made progress which resulted in the findings in both the Medicare and Health Programs being reduced to a reportable condition or incorporated into the Managed Care Benefit Expense Cycle material weakness. Both CDC and FDA continued to record thousands of nonstandard accounting entries both prior and subsequent to the UFMS conversion. FDA recorded 14 thousand non-standard accounting entries totaling an absolute value of approximately $9.4 billion to create the September 30, 2005 financial statements. FDA noted this was primarily due to the productivity dip and lack of familiarity with the system. To prepare the September 30, 2005 financial statements, CDC indicated that it was required to record the following:
For the second subcomponent -- Medicare electronic data processing controls, much of that finding has been corrected and is also now classified by the auditors as a reportable condition.
Federal Financial Management Improvement Act
FFMIA mandates that agencies “�implement and maintain financial management systems that comply substantially with Federal financial management systems requirements, applicable Federal accounting standards and the United States Government Standard General Ledger at the transaction level.” FFMIA also requires that remediation plans be developed for any entity that is unable to report substantial compliance with these requirements. The Department’s FY 2005 financial statement audit revealed one instance of noncompliance - Financial Systems and Processes, in which HHS financial management systems did not substantially comply with federal financial management systems requirements. The one noncompliance includes four sub-components; 1a) CMS’ financial systems analysis and oversight, 1b) the Department’s Payroll System, 1c) the CORE accounting system, and 1d) NIH’s Center for Information Technology (CIT). HHS concurs with the auditor’s findings. In last year’s report (FY 2004 PAR), the auditors reported 3 FFMIA noncompliances: 1) Financial Systems and Processes, 2) CMS Financial Systems and Analysis, and 3) Departmental Payroll System. These three noncompliances have now been consolidated into one noncompliance with 2 sub-components. In addition, the auditors identified 2 new noncompliances -- the core accounting system and the NIH Center for Information Technology (CIT), which they are reporting as additional sub-components of the one noncompliance, Financial Systems and Processes.
Federal Information Security Management Act
HHS’ FY 2005 FISMA evaluation determined that the significant deficiency involving contingency planning and disaster recovery for some of HHS systems has been corrected to the extent that it is no longer considered to be a significant deficiency, although some corrective actions are ongoing.
Improper Payments Information Act of 2002 (IPIA)
The IPIA requires that HHS annually review all programs and activities that it administers and identify all such programs and activities that may be susceptible to significant improper payments. For high risk programs, the IPIA requires that HHS report improper payment estimates and various other related data. Although HHS did not identify high risk programs in its FY 2005 risk assessment work, seven HHS programs were previously identified by OMB as being high risk. These programs are Medicare, Medicaid, SCHIP, TANF, Foster Care, Head Start and Child Care. HHS is reporting improper payment estimates in the Medicare fee-for-service, Head Start and Foster Care programs. For the Medicaid, SCHIP, TANF and Child Care Programs, HHS is working on developing or implementing plans to determine estimated amounts of improper payments. More detailed Information on HHS improper payment activities can be found in Appendix C.
The breadth of services that HHS delivers and the myriad support functions required to support them create a number of management challenges, which help set the course for HHS improvement efforts each year. The OIG identifies these challenges and tracks HHS’ progress in resolving them. Pursuant to the Reports Consolidation Act of 2000, Appendix A addresses the challenges identified by the OIG, and management’s detailed responses to those challenges. As shown in the accompanying chart, many of the initiatives discussed in this report, both under the auspices of the PMA and HHS’ own strategic goals, address these challenges. It should be noted that because many of the PMA initiatives address, in great part, government-wide issues, there will not necessarily be a complete correlation between HHS’ management challenges and each of the PMA initiatives. There is, however, a more direct relationship between the challenges identified and HHS’ strategic goals. It is this relationship that articulates, in part, HHS’ efforts to resolve these challenges. As such, through the Department’s many initiatives, HHS continually strives to improve not only the quality of services it delivers to its “customers” and beneficiaries, but also to enhance management effectiveness and efficiency.
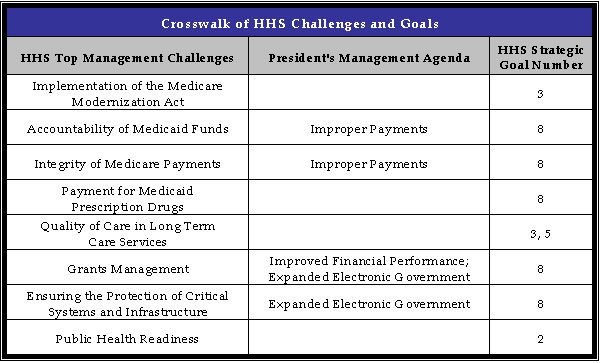
--------------------
1 Due to a shortage of vaccine and temporary change in recommendations, reported 3 doses from 2002 - 2003.
2 Includes any measles-containing vaccine.
3 Performance targets for newly recommended vaccines, such as pneumococcal conjugate vaccine and influenza vaccine, are reported in GPRA 5 years after Advisory Committee on Immunization Practices recommendation. Measures for pneumococcal conjugate vaccine (PCV7) will begin in 2006 and influenza in 2009.
4 http://www.healthierus.gov/steps/summit/prevport/power/ ; accessed November 1, 2005
5 Revised from 49,000 as reported in the FY 2006 Congressional Justification.
6 In FY 2002, 881,869 children were up-to-date on a schedule of age-appropriate preventive and primary health care; 186,572 children received medical treatment as a result of a diagnosed health condition.
7 Per Improper Payments Information Act (IPIA) requirements, HHS began reporting on gross (under- and over- payments) results (as shown in the table above) in FY 2004. The FY 2004 net result was 9.3%.
8 HHS reported an unadjusted paid claims error rate of 9.8%, and an adjusted paid claims error rate of 5.8% (as shown in the table above) in FY 2003.
9 Grant volume and dollar analysis covers FYs 2001-2004. FY 2005 data was omitted from this analysis as its preliminary nature at the time of completion of this report would have significantly skewed the analysis