


Biological Product Deviation Reports
Annual Summary for Fiscal Year 2005
Printable version of this document
Table of Contents
- Executive Summary
- FY05: BPD Reports Submitted by Blood and Plasma Establishments
- Most Frequent BPD Reports Submitted by Licensed Blood Establishments
- Most Frequent BPD Reports Submitted by Unlicensed Blood Establishments
- Most Frequent BPD Reports Submitted by Transfusion Services
- Most Frequent BPD Reports Submitted by Plasma Centers
- Timeliness of BPD Reports
- FY05: BPD Reports Submitted by Manufacturers of Biological Products Other than Blood and Blood Components
- Attachments
- We received more than 38,756 reports, but reports that did not meet the reporting threshold were not captured. The reporter was notified that a report was not required.
- 38,372 reports were submitted by blood and plasma establishments, an increase of 1.4% above FY04 (37,830) {Table #2}.
- 384 reports were submitted by non-blood manufacturers of biological products (allergenic, in-vitro diagnostic, derivative, or vaccine), an increase of 16% above FY04 (332) {Table #2}.
- The number of reporting establishments decreased by 5% (1,479 establishments in FY04 and 1,409 establishments in FY05) {Table #2).
- Unregistered transfusion services typically report few BPDs (67% of those reporting in FY04 and FY05 submitted 1 or 2 reports) and may file no reports (180 transfusion services that reported in FY04 did not report in FY03; 199 that reported in FY05 did not in FY04). Only 18% of the transfusion services submitted more than 5 reports during FY05.
- The number of source plasma centers (individual registered locations) reporting in FY05 (286) decreased by 20% below FY04 (357). There was a corresponding 6% decrease in the number of reports submitted by plasma centers, from 5,115 in FY04 to 4,805 in FY05.
- There was an increase of 3 percentage points in the number of establishments reporting electronically. (FY04 - 66% {970/1,479}; FY05 - 69% {974/1,409}). We continue to encourage electronic reporting.
- Reports of post-donation information (PDI) continue to represent the largest subset of BPD reports submitted by blood and plasma establishments (72%) {Table #7}. Most often (90%), the blood collector is made aware during a subsequent donation interview {Table 9}. In 88% of the PDI reports the donor was aware of the information, but the donor screening process failed to elicit the information {Table #10}. It is unclear why information not elicited during the first donor screening is successfully elicited during a subsequent interview. It is clear that the most common PDI relates to travel (54%). Eliciting proper information regarding a donor candidate's travel history is apparently the most problematic part of the donor qualification process.
- 2,271 (6%) of the reports received by CBER were sent to FDA District Offices for follow-up/evaluation as potential recall situations {Table #1}.
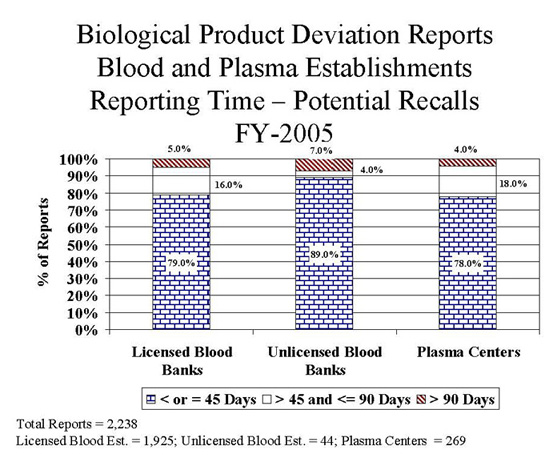
- Of the 2,238 reports submitted by blood and plasma establishments, deviations and unexpected events that occur during the donor screening process continue to be leading cause of potential recall situations (43%) {Table #8}.
- There was a 36% increase in the number of reports submitted by blood and plasma establishments in which a unit was distributed that was collected from a donor who subsequently tested confirmed positive for HCV (FY03 - 154, FY04 - 244, FY05 - 333). Based the number of questions we received regarding the requirement to report this event, we believe the increase was most likely due to under reporting of this type of event in the previous year, rather than an increase in the number of donors who subsequently tested confirmed positive for any viral marker.
- The number of reports submitted by blood and plasma establishments involving donor screening decreased by 19% (FY04 - 2,007, FY05 - 1,628) {Table #3}.
- The number of reports involving records which were incomplete, incorrect, or not reviewed related to donor history questions decreased by 32% (FY04 - 478, FY05 - 324).
- The number of reports in which a donor provided disqualifying information regarding travel to a malarial endemic area and was inappropriately accepted decreased by 15% (FY04 - 461, FY05 - 391).
- Number of BPD Reports by Type of Blood Establishment
- List of BPD Codes for Blood and Plasma
- Number of BPD Reports by Type of Non-Blood Manufacturer
- List of BPD Codes for Non-Blood
- Donor traveled to malarial endemic area and non-transfusable plasma product was the only product distributed.
- Testing was not complete, but the unit was released using emergency release protocol.
- No products were distributed.
- The event occurred outside the control of the manufacturer, for example on the nursing floor.
- Donor reported post donation cold or flu symptoms.
- Allogeneic unit was issued when an autologous or directed unit was available.
- Recipient had Transfusion Related Acute Lung Injury (TRALI).
- Donor screening events were coded as post donation information. The event should only be coded as post donation information if the disqualifying information was not known by the blood center at the time of donation. If the disqualifying information is known and the donor is not appropriately deferred, the event should be coded as a donor screening deviation.
- Events in which testing was not performed were coded as Routine Testing (incorrectly performed or interpreted) deviations instead of Quality Control & Distribution. For example, if a patient had a history of an antibody and the unit was not screened for the corresponding antigen, the deviation code should be QC9311 (Required testing not performed or documented for: antigen screen), not RT6106 (Testing performed, interpreted, or documented incorrectly for: antigen typing)
- Blood Collection events in which a unit was distributed that was clotted (BC4305) were coded as QC & Distribution - associated product contained clots (QC9409). If the product that was clotted was distributed, the Blood Collection deviation code should be used. If the product (e.g., FFP) associated with a component that was clotted (e.g., RBC) was distributed, the QC & Distribution code should be used.
- A number of reports involving units distributed in which bacterial detection testing was positive, not performed, incomplete or performed incorrectly were coded incorrectly. All events associated with bacterial detection testing should be coded as QC & Distribution; Distribution of product that did not meet specifications; Product with unacceptable (e.g., positive), undocumented, or incomplete product QC (QC9404).
- In FY05, the number of these reports increased by 3% (FY04 - 21,840).
- The number of reports in which a donor subsequently provided information regarding travel to a CJD risk area decreased by 7% (FY04 - 6,053).
- The number of reports in which a donor reported a subsequent diagnosis of cancer decreased by 24% (FY04 - 728).
- In FY05, the number of these reports was similar to reports received in the previous fiscal year (FY04 - 1,452).
- The number of reports involving the release of a product with unacceptable, undocumented, or incomplete product QC, specifically related to bacterial detection testing used as a quality control test, increased 58% (FY04 - 243).
- In FY05, the number of these reports decreased by 21% (FY04 - 1,617). Specific areas in which there was a decrease in the number of report were as follows:
- 51% decrease in reports in which the incorrect donor identification was used to check the deferral file or the deferral file was not checked, i.e., deferral screening not done (FY04 - 327, FY05 - 160)
- 32% decrease in reports involving donor records which were incomplete, incorrect or not reviewed, specifically related to the donor history questions (FY04 - 399). Of the 268 reports related to donor history questions incomplete, incorrect or not reviewed, there were 22 reports related to the use of an abbreviated donor history questionnaire when a full-length questionnaire should have been used compared to 60 reports in FY04.
- In FY05, the number of these reports increased by 17% (FY04 -798).
- The number of reports in which a clotted product was discovered after distribution increased by 27% (FY04-511).
- In FY05, the number and distribution of these reports were similar to the reports received in the previous fiscal year (FY04 - 868).
- In FY05, the number of these reports increased by 17% (FY04 - 1,381). This increase was associated with an increase by 83% in the number of reports in which a product was not documented as issued in the computer (FY04 - 237). This type of event is reportable if the computer system is used as the only documentation of the final checks of the issue process.
- The number of reports involving the release of a product with unacceptable, undocumented or incomplete product QC, specifically associated with the implementation of bacterial detection testing used as a quality control test, increased from 46 reports in FY04 to 115 reports (86 reports involved bacterial detection testing) in FY05.
- In FY05, the number of these reports was similar to the previous fiscal year (FY04 - 1,062).
- In FY05, the number of these reports increased by 28% (FY04 - 413).
- The number of reports of involving donor traveling to a malarial endemic area increased by 71% (FY04 - 100).
- In FY05, the number and distribution of these reports were similar to the reports received in the previous fiscal years (FY02 - 407, FY03 - 404, FY03 - 386).
- In FY05, the number of these reports was similar to the reports received in the previous fiscal year (FY04 - 743).
- In FY05, the number and distribution of these reports was similar to the reports received in the previous fiscal year (FY04 - 470).
- In FY05, the number of these reports decreased by 21% (FY04 - 369).
- The number of reports involving testing decreased by 14% (FY04 - 204).
- The number of reports involving samples used for testing that were incorrectly or incompletely labeled decreased by 38% (FY04 - 128).
- In FY05, the number of these reports decreased by 4% (FY04 - 4,601).
- In FY04, 460 reports were submitted by 80 plasma centers that did not submit reports in FY05 due to closure of center.
- The number of post donation information reports in which the donor was previously incarcerated decreased by 33% (FY04 - 494).
- In FY05, the number of these reports decreased by 34% (FY04 - 285).
- The number of reports in which the donor provided disqualifying information and was not deferred decreased by 71% (FY04 - 134).
- The number of reports in which the donor record was incomplete, incorrect or not reviewed decreased by 40% (FY04 - 104).
- The number of reports submitted by in-vitro diagnostic, derivative and vaccine manufacturers, were similar to the number of reports submitted the previous year (FY04 - in-vitro diagnostic - 86, derivative - 44, vaccine - 42).
- There was a slight increase in the number of reports submitted by Allergenic manufacturers (FY04 - 158).
- 166 of 177 (94%) of product specification reports were related to precipitate discovered in allergenic extracts.
Biological Product Deviations (BPD) Reports must be submitted to the Center for Biologics Evaluation and Research (CBER) by licensed manufacturers of blood and blood components, including Source Plasma; unlicensed registered blood establishments; transfusion services who had control over the product when the deviation occurred (21 CFR 606.171), and by the non-blood manufacturer who holds the biological product license for and had control over the product when the deviation occurred (21 CFR 600.14). Detailed information concerning BPD reporting is available at www.fda.gov/cber/biodev/biodev.htm.
From October 1, 2004 through September 30, 2005 (Fiscal Year 2005 or FY05), CBER's Office of Compliance and Biologics Quality/Division of Inspections and Surveillance entered 38,756 BPD reports into the BPD database:
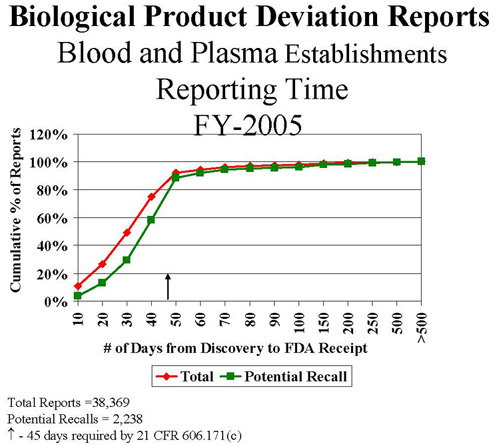
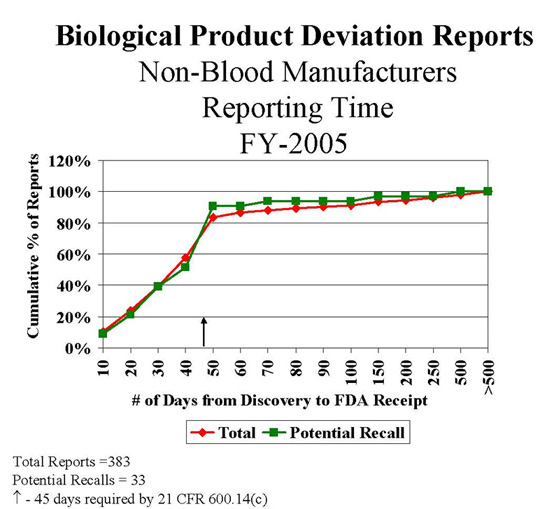
BPD reports must be submitted within 45 calendar days of the date of discovery of the reportable event. In FY05, 87% of the blood BPD reports and 75% of the non-blood BPD reports were submitted within 45 days {Tables #26 and #30}. The number of reports submitted by non-blood manufacturers within 45 days increased by 6% (226/330 {69%} in FY04). FDA investigators review reporting practices during establishment inspections and we continue to publicize reporting requirements through professional meetings and publications.
FDA published two draft guidance documents in FY01 to assist industry in determining what events are reportable1,2. We are evaluating the comments received concerning these drafts and anticipate publication of final guidance in the near future.
Questions concerning this summary may be submitted to:
FDA/Center for Biologics Evaluation and Research
Office of Compliance and Biologics Quality
Division of Inspections and Surveillance (HFM-650)
1401 Rockville Pike, Suite 200 North
Rockville , Maryland 20852-1448
You may also contact us by email at bp_deviations@fda.hhs.gov, sharon.ocallaghan@fda.hhs.gov (Sharon O'Callaghan), or susan.cannon@fda.hhs.gov (Sue Cannon) or by phone at 301-827-6220.
Attachments
Footnotes
1Guidance for Industry - Biological Product Deviation Reporting for Blood and Plasma Establishments 8/11/2001
2Guidance for Industry - Biological Product Deviation Reporting for Licensed Manufacturers of Biological Products Other than Blood and Blood Components 8/11/2001
Total BPD Reports
FY05
| Number Of Reporting Establishments | Total Reports Received | Potential Recalls | ||
|---|---|---|---|---|
| Blood/Plasma Manufacturers | ||||
| Licensed Blood Establishments | 230(115*) | 28,153 | 1,925 | 6.8% |
| Unlicensed Blood Establishments 1 | 392 | 3,897 | 44 | 1.1% |
| Transfusion Services 2 | 457 | 1,517 | 0 | 0% |
| Plasma Centers | 286(53*) | 4,805 | 269 | 5.6% |
| Sub-Total | 1,365 | 38,372 | 2,238 | 5.8% |
| Non-Blood Manufacturers | ||||
| Allergenic | 8 | 200 | 13 | 6.5% |
| Blood Derivative | 14 | 47 | 2 | 4.2% |
| In-Vitro Diagnostic | 11 | 100 | 18 | 18.0% |
| Vaccine | 11 | 37 | 0 | 0% |
| Sub-Total | 44 | 384 | 33 | 8.6% |
| Total | 1,409 | 38,756 | 2,271 | 5.9% |
1Unlicensed Blood Establishments - unlicensed blood establishments performing manufacturing of blood and blood components that require registration with FDA
2 Transfusion Service - blood banks that perform limited blood and blood component manufacturing (e.g. pooling, thawing, compatibility testing), may or may not be registered with FDA.
*Number of license holders; one or more establishments operate under one biologics license.
Total BPD Reports
FY02 - FY04
| Number Of Reporting Establishments | Total Reports Received | Potential Recalls | |||||||
|---|---|---|---|---|---|---|---|---|---|
| Blood/Plasma Manufacturers | FY03 | FY04 | FY05 | FY03 | FY05 | FY05 | FY03 | FY04 | FY05 |
| Licensed Blood Establishments | 236(125*) | 237(117*) | 230(115*) | 28,361 | 27,621 | 28,153 | 1,598 | 2,170 | 1,925 |
| Unlicensed Blood Establishments | 374 | 371 | 392 | 3,022 | 3,502 | 3,897 | 53 | 58 | 44 |
| Transfusion Services | 499 | 468 | 457 | 1,502 | 1,592 | 1,517 | 0 | 0 | 0 |
| Plasma Centers | 378(59*) | 357(55*) | 286(53*) | 7,611 | 5,115 | 4,805 | 635 | 377 | 269 |
| Sub-Total | 1,487 | 1,433 | 1,365 | 40,496 | 37,830 | 38,372 | 2,286 | 2,605 | 2,238 |
| Non-Blood Manufacturers | |||||||||
| Allergenic | 9 | 9 | 8 | 165 | 158 | 200 | 3 | 5 | 13 |
| Blood Derivative | 19 | 17 | 14 | 56 | 44 | 47 | 5 | 4 | 2 |
| In-Vitro Diagnostic | 7 | 10 | 11 | 44 | 86 | 100 | 4 | 8 | 18 |
| Vaccine | 12 | 9 | 11 | 56 | 42 | 37 | 5 | 1 | 1 |
| Sub-Total | 56 | 46 | 44 | 339 | 332 | 384 | 19 | 18 | 33 |
| Total | 1,543 | 1,479 | 1,409 | 40,835 | 38,162 | 38,756 | 2,305 | 2,623 | 2,271 |
* Number of license holders; one or more establishments operate under one biologics license.
Blood & Plasma BPD Reports By Manufacturing System
FY03 - FY05
| MANUFACTURING SYSTEM | FY03 | FY04 | FY05 | |||
|---|---|---|---|---|---|---|
| DONOR SUITABILITY | 32,443 | 80.1% | 28,952 | 76.5% | 29,148 | 76.0% |
| POST DONATION INFORMATION | 30,321 | 74.9% | 26,854 | 71.0% | 27,452 | 71.5% |
| DONOR SCREENING | 2,030 | 5.0% | 2,007 | 5.3% | 1,628 | 4.2% |
| DONOR DEFERRAL | 92 | 0.2% | 91 | 0.2% | 68 | 0.2% |
| QC & DISTRIBUTION | 2,705 | 6.7% | 3,740 | 9.9% | 3,934 | 10.3% |
| LABELING | 2,430 | 6.0% | 2,415 | 6.4% | 2,405 | 6.3% |
| LABORATORY TESTING | 1,126 | 2.8% | 1,122 | 3.0% | 981 | 2.6% |
| ROUTINE TESTING | 1,037 | 2.6% | 1,027 | 2.7% | 912 | 2.4% |
| VIRAL TESTING | 89 | 0.2% | 95 | 0.3% | 69 | 0.2% |
| COLLECTION | 1,133 | 2.8% | 851 | 2.2% | 972 | 2.5% |
| COMPONENT PREPARATION | 371 | 0.9% | 368 | 1.0% | 407 | 1.1% |
| MISCELLANEOUS | 288 | 0.7% | 382 | 1.0% | 525 | 1.4% |
| TOTAL | 40,496 | 100% | 37,830 | 100% | 38,372 | 100% |
Non-Blood BPD Reports By Manufacturing System
FY03 - FY05
Table 4
| Manufacturing System | Allergenic | Derivative | In-Vitro Diagnostic | ||||||
|---|---|---|---|---|---|---|---|---|---|
| FY03 | FY04 | FY05 | FY03 | FY04 | FY05 | FY03 | FY04 | FY05 | |
| Incoming Material | 1 | 2 | 0 | 1 | 9 | 9 | 2 | 5 | 4 |
| Process Controls | 0 | 2 | 1 | 6 | 9 | 5 | 9 | 20 | 18 |
| Testing | 0 | 0 | 0 | 8 | 0 | 3 | 7 | 14 | 17 |
| Labeling | 5 | 8 | 22 | 1 | 3 | 15 | 10 | 16 | 24 |
| Product Specifications | 158 | 146 | 177 | 31 | 15 | 11 | 10 | 23 | 30 |
| Quality Control & Distribution | 1 | 0 | 0 | 7 | 7 | 4 | 5 | 6 | 7 |
| Miscellaneous | 0 | 0 | 0 | 0 | 1 | 0 | 1 | 2 | 0 |
| TOTAL | 165 | 158 | 200 | 56 | 44 | 47 | 44 | 86 | 100 |
| Manufacturing System | Vaccine | Total | ||||
|---|---|---|---|---|---|---|
| FY03 | FY04 | FY05 | FY03 | FY04 | FY05 | |
| Incoming Material | 4 | 1 | 1 | 11 | 17 | 14 |
| Process Controls | 1 | 7 | 4 | 16 | 38 | 28 |
| Testing | 12 | 4 | 1 | 27 | 18 | 21 |
| Labeling | 15 | 10 | 12 | 31 | 37 | 73 |
| Product Specifications | 21 | 17 | 17 | 210 | 201 | 235 |
| Quality Control & Distribution | 2 | 1 | 2 | 15 | 14 | 13 |
| Miscellaneous | 1 | 2 | 0 | 2 | 5 | 0 |
| TOTAL | 56 | 42 | 37 | 321 | 330 | 384 |
The on-line electronic BPD report form was implemented on June 18, 2001. The percentage of reports submitted electronically in FY05 increased by 5.4 percentage points from FY04 (from 56.5% to 61.9%). We continue to encourage all reporters to use the electronic reporting format.
BPD Reports Submitted Electronically
Table 5
| Total Reports | # of eBPDR | % eBPDR | |
|---|---|---|---|
| BLOOD/PLASMA MANUFACTURERS | |||
| LICENSED BLOOD ESTABLISHMENTS | 28,153 | 16,501 | 58.6% |
| UNLICENSED BLOOD ESTABLISHMENTS | 3,897 | 3,537 | 90.8% |
| TRANSFUSION SERVICES | 1,517 | 1,212 | 79.9% |
| PLASMA CENTERS | 4,805 | 2,482 | 51.7% |
| SUB-TOTAL | 38,372 | 23,732 | 61.8% |
| NON-BLOOD MANUFACTURERS | |||
| ALLERGENIC | 200 | 187 | 93.5% |
| DERIVATIVE | 47 | 14 | 29.8% |
| IN-VITRO DIAGNOSTIC | 100 | 53 | 53.0% |
| VACCINE | 37 | 2 | 5.4% |
| SUB-TOTAL | 384 | 256 | 66.5% |
| TOTAL | 38,756 | 23,988 | 61.9% |
Percent of Electronic BPD Reports
Table 6
| FY03 | FY04 | FY05 | |
|---|---|---|---|
| BLOOD/PLASMA MANUFACTURERS | |||
| LICENSED BLOOD ESTABLISHMENTS | 41.8% | 52.1% | 58.6% |
| UNLICENSED BLOOD ESTABLISHMENTS | 84.2% | 88.9% | 90.8% |
| TRANSFUSION SERVICES | 75.5% | 81.9% | 79.9% |
| PLASMA CENTERS | 28.3% | 49.6% | 51.7% |
| SUB-TOTAL | 43.7% | 56.4% | 61.8% |
| NON-BLOOD MANUFACTURERS | |||
| ALLERGENIC | 60.0% | 81.6% | 93.5% |
| DERIVATIVE | 19.3% | 50.0% | 29.8% |
| IN-VITRO DIAGNOSTIC | 72.7% | 65.1% | 53.0% |
| VACCINE | 8.9% | 14.3% | 5.4% |
| SUB-TOTAL | 45.9% | 64.2% | 66.5% |
| TOTAL | 43.7% | 56.5% | 61.9% |
II. FY05: BPD Reports Submitted By Blood And Plasma Establishments:
Total BPDs By Manufacturing System
| Manufacturing System | Licensed Establishments | Unlicensed Establishments | Transfusion Services | Plasma Centers | Total | |
|---|---|---|---|---|---|---|
| DS-Post Donation Information | 22,498 | 530 | NA | 4,424 | 27,452 | 71.5% |
| QC & Distribution | 1,486 | 1,618 | 727 | 103 | 3,934 | 10.3% |
| Labeling | 854 | 1,052 | 492 | 7 | 2,405 | 6.3% |
| DS-Donor Screening | 1,272 | 169 | NA | 187 | 1,628 | 4.2% |
| Blood Collection | 931 | 39 | NA | 2 | 972 | 2.5% |
| LT-Routine Testing | 228 | 391 | 292 | 1 | 912 | 2.4% |
| Miscellaneous | 455 | 6 | 0 | 64 | 525 | 1.4% |
| Component Preparation | 320 | 81 | 6 | 0 | 407 | 1.1% |
| LT-Viral Testing | 60 | 8 | NA | 1 | 69 | 0.2% |
| DS-Donor Deferral | 49 | 3 | NA | 16 | 68 | 0.2% |
| TOTAL | 28,153 | 3,897 | 1,517 | 4,805 | 38,372 | 100% |
DS - Donor Suitability
LT - Laboratory Testing
NA - Not applicable: manufacturing not performed in transfusion service
Potential Recalls By Manufacturing System
| Manufacturing System | Licensed Establishments | Unlicensed Establishments | Transfusion Services | Plasma Centers | Total | |
|---|---|---|---|---|---|---|
| DS-Donor Screening | 786 | 24 | NA | 148 | 958 | 42.8% |
| QC & Distribution | 579 | 6 | 0 | 91 | 676 | 30.2% |
| Component Preparation | 172 | 7 | NA | 0 | 179 | 8.0% |
| Blood Collection | 174 | 1 | NA | 1 | 176 | 7.9% |
| Labeling | 74 | 3 | 0 | 0 | 77 | 3.4% |
| DS-Post Donation Information | 44 | 1 | NA | 18 | 63 | 2.8% |
| DS-Donor Deferral | 36 | 2 | NA | 11 | 49 | 2.2% |
| LT-Viral Testing | 33 | 0 | NA | 0 | 33 | 1.5% |
| LT-Routine Testing | 26 | 0 | 0 | 0 | 26 | 1.2% |
| Miscellaneous | 1 | 0 | 0 | 0 | 1 | 0.0% |
| TOTAL | 1,925 | 44 | 0 | 269 | 2,238 | 100% |
DS - Donor Suitability
LT - Laboratory Testing
NA - Not applicable: manufacturing not performed in transfusion service
Post donation information (PDI) continues to be the most frequently reported event associated with the manufacturing of blood and plasma products. The most common PDI involved donors providing information concerning travel to malarial endemic areas and travel to an area at potential risk for vCJD. It is unclear why information not elicited during the first donor interview is successfully elicited during a subsequent interview. Eliciting proper information regarding a donor candidate's travel history is apparently the most problematic part of the donor qualification process.
FY05 Reports of Post Donation Information (PDI)
| PDI OBTAINED THROUGH: | LICENSED ESTABLISHMENTS | UNLICENSED ESTABLISHMENTS | PLASMA CENTERS | TOTAL | |
|---|---|---|---|---|---|
| Subsequent Donation | 20,450 | 468 | 3,729 | 24,648 | 89.8% |
| Telephone Call from Donor | 1,429 | 56 | 30 | 1,515 | 5.5% |
| Third Party (e.g., doctor, family) | 393 | 6 | 665 | 1,064 | 3.9% |
| Telerecruitment | 226 | 0 | 0 | 226 | 0.8% |
| TOTAL | 22,498 | 530 | 4,424 | 27,452 | 100% |
| THE PDI WAS: | LICENSED ESTABLISHMENTS | UNLICENSED ESTABLISHMENTS | PLASMA CENTERS | TOTAL | |
|---|---|---|---|---|---|
| Known, but not Provided at Time of Donation* | 20,132 | 435 | 3630 | 24,197 | 88.1% |
| Not Known at Time of Donation** | 2,366 | 95 | 794 | 3,255 | 11.9% |
| TOTAL | 22,498 | 530 | 4,424 | 27,452 | 100% |
*Known, e.g., travel outside of U.S., tattoo or body piercing, history of cancer
**Not known, e.g., post donation illness, cancer diagnosed post donation, sex partner participated in high risk behavior or tested positive
REPORTING ISSUES
In response to request for providing more useful information in the annual summary reports, this section addresses non-reportable events and problems in reporting.
Non-Reportable Events
Most of the non-reportable reports were submitted by blood establishments. The reports were determined to not meet the reporting threshold. The events were either not associated with manufacturing, did not affect the safety, purity or potency of the product, or involved products that were not distributed. Examples of events that were considered not reportable include:
Coding Issues
In some cases the incorrect deviation code was selected to capture the event. The most common errors in coding were:
Product Information
The incorrect number of units was listed on a number of reports. When identifying the number of units and components, the number of units should equal the number of donations. For example if the event involved 2 donations and each donation was manufactured into red blood cells, platelets and plasma, the number of units would be 2 and the number of components would be 6. Some reports listed the number of units as 6 and the number of components as 6.
II. A. Most Frequent BPD Reports Submitted by Licensed Blood Establishments
Of the 28,153 reports submitted by licensed blood establishments, 22,498 (79.9%) reports involved post donation information.
Most Frequent BPD Reports - Post Donation Information
From Licensed Blood Establishments
Table 11
| POST DONATION INFORMATION (PD) 22,498 | # Reports | % of Total PD |
|---|---|---|
| Behavior/History | 20,168 | 89.64% |
| Travel to malaria endemic area/history of malaria | 6,562 | 29.17% |
| Risk factors associated with Creutzfeldt-Jakob Disease (CJD) - travel | 5,659 | 25.15% |
| History of cancer | 1,159 | 5.15% |
| Donor received tattoo within 12 months of donation | 817 | 3.63% |
| Male donor had sex with another man | 618 | 2.75% |
| Received Proscar, Tegison or Accutane | 603 | 2.68% |
| History of disease | 486 | 2.16% |
| IV drug use | 421 | 1.87% |
| Donor received bone graft or transplant | 418 | 1.86% |
| Sex partner lived in or immigrated from an HIV Group O risk area | 243 | 1.08% |
| Illness | 1,906 | 8.47% |
| Post donation illness (not hepatitis, HIV, HTLV-I, STD, or cold/flu related) | 1,261 | 5.60% |
| Reaction at phlebotomy site | 66 | 0.29% |
| Babesiosis | 28 | 0.12% |
| Non-specific symptoms - possible West Nile Virus | 27 | 0.12% |
| West Nile Virus | 7 | 0.03% |
| Post donation diagnosis of cancer | 551 | 2.45% |
| Testing * | 299 | 1.33% |
| Tested reactive for Hepatitis C post donation | 56 | 0.25% |
| Tested reactive for HIV post donation | 50 | 0.22% |
| Tested reactive for Hepatitis B post donation | 44 | 0.20% |
| Tested reactive for HIV prior to donation | 33 | 0.15% |
| Tested reactive for hepatitis not specified, prior to donation | 29 | 0.13% |
| Not specifically related to high risk behavior | 125 | 0.56% |
| Donated to be tested or called back for test results | 71 | 0.32% |
| Donor does not want their blood used | 53 | 0.24% |
*Includes: tested positive for viral marker either prior to or post donation
Of the 28,153 reports submitted by licensed blood establishments, 1,486 (5.3%) reports involved quality control and distribution deviations and unexpected events.
Most Frequent BPD Reports - Quality Control & Distribution
From Licensed Blood Establishments
Table 12
| QC & DISTRIBUTION (QC) 1,486 | # Reports | % of Total (QC) |
|---|---|---|
| Distribution of product that did not meet specifications | 1,031 | 69.4% |
| Product with unacceptable, undocumented, or incomplete product QC | 553 | 37.2% |
| Bacterial Detection Testing | 385 | 25.9% |
| Platelet count | 66 | 4.4% |
| White Blood Cell count | 31 | 2.1% |
| Product in which instrument QC or validation was unacceptable or not documented | 104 | 7.0% |
| Product released prior to resolution of discrepancy | 88 | 5.9% |
| Product identified as unsuitable due to a donor screening deviation or unexpected event | 74 | 5.0% |
| Product associated with product that contained clots or hemolysis | 65 | 4.4% |
| Shipping and storage | 212 | 14.3% |
| Product not packaged in accordance with specifications | 61 | 4.1% |
| No documentation that product was shipped or stored at appropriate temperature | 38 | 2.6% |
| Shipped at incorrect temperature | 34 | 2.3% |
| Distribution procedures not performed in accordance with blood bank transfusion service's specifications | 116 | 7.8% |
| Product not documented as issued in computer | 31 | 2.1% |
| Product not irradiated as required | 20 | 1.4% |
| Improper product selected for patient | 16 | 1.1% |
| Required testing incorrect, incomplete, or positive | 50 | 3.4% |
| Failure to quarantine unit due to medical history: | 46 | 3.1% |
| Post donation illness | 16 | 1.1% |
| Required testing not performed or documented | 29 | 2.0% |
Of the 28,153 reports submitted by licensed blood establishments, 1,272 (4.5%) reports involved donor screening deviations and unexpected events.
Most Frequent BPD Reports - Donor Screening
From Licensed Blood Establishments
Table 13
| DONOR SCREENING (DS) 1,272 | # Reports | % of Total DS |
|---|---|---|
| Donor gave history which warranted deferral and was not deferred | 705 | 55.4% |
| Travel to malaria endemic area/history of malaria | 362 | 28.5% |
| Risk factors associated with Creutzfeldt-Jakob Disease (vCJD) - travel | 110 | 8.6% |
| Received medication or antibiotics | 52 | 4.1% |
| History of cancer | 47 | 3.7% |
| History of disease | 24 | 1.9% |
| Donor record incomplete or incorrect | 337 | 26.5% |
| Donor history questions | 268 | 21.1% |
| Donor identification | 27 | 2.1% |
| Arm inspection | 14 | 1.1% |
| Incorrect ID used during deferral search | 145 | 11.4% |
| Donor not previously deferred | 122 | 9.6% |
| Donor previously deferred due to history | 12 | 0.9% |
| Donor previously deferred due to testing | 11 | 0.9% |
| Donor did not meet acceptance criteria | 65 | 5.1% |
| Hemoglobin or Hematocrit unacceptable or not documented | 32 | 2.5% |
| Temperature unacceptable or not documented | 26 | 2.0% |
| Deferral screening not done | 15 | 1.2% |
| Donor previously deferred due to history | 9 | 0.7% |
| Donor previously deferred due to testing | 5 | 0.4% |
| Donor not previously deferred | 1 | 0.1% |
Of the 28,153 reports submitted by licensed blood establishments, 931 (3.3%) reports involved blood collection deviations and unexpected events.
Most Frequent BPD Reports - Blood Collection
From Licensed Blood Establishments
Table 14
| BLOOD COLLECTION (BC) 931 | # Reports | % of Total BC |
|---|---|---|
| Collection Process | 762 | 81.8% |
| Product contained clots, not discovered prior to distribution | 647 | 69.5% |
| Product hemolyzed, not discovered prior to distribution | 51 | 5.5% |
| Sterility compromised | 96 | 10.3% |
| Bacterial contamination | 46 | 4.9% |
| Air contamination | 25 | 2.7% |
| Arm prep not performed or performed inappropriately | 24 | 2.6% |
| Collection Bag | 39 | 4.2% |
| Apheresis collection device | 25 | 2.7% |
Of the 28,153 reports submitted by licensed blood establishments, 854 (3.0%) reports involved labeling deviations and unexpected events.
Most Frequent BPD Reports - Labeling
From Licensed Blood Establishments
Table 15
| LABELING (LA) 854 | #Reports | % of Total LA |
|---|---|---|
| Blood unit labels | 443 | 51.9% |
| Extended expiration date or time | 86 | 10.1% |
| Volume incorrect or missing | 66 | 7.7% |
| ABO and/or Rh incorrect | 50 | 5.9% |
| Donor number or lot number incorrect or missing | 43 | 5.0% |
| Crossmatch tag or tie tag labels incorrect or missing information | 375 | 43.9% |
| Recipient identification missing or incorrect | 245 | 28.7% |
| Autologous unit | 99 | 11.6% |
| Crossmatch tag switched, both units intended for the same patient | 20 | 2.3% |
| Antigen incorrect or missing | 18 | 2.1% |
| Transfusion record (crossmatch slip) incorrect or missing information | 35 | 4.1% |
| Recipient identification missing or incorrect | 15 | 1.8% |
II. B. Most Frequent BPD Reports Submitted by Unlicensed Blood Establishments
Of the 3,897 reports submitted by unlicensed blood establishments, 1,618 (41.5%) involved quality control and distribution deviations and unexpected events.
Most Frequent BPD Reports - Quality Control & Distribution
From Unlicensed Blood Establishments
Table 16
| QC & Distribution (QC) 1,618 | # Reports | % of Total QC |
|---|---|---|
| Distribution procedures not performed in accordance with blood bank transfusion service's specifications | 1,199 | 74.1% |
| Product not documented as issued in the computer | 434 | 26.8% |
| Product not irradiated as required | 173 | 10.7% |
| Procedure for issuing not performed or documented in accordance with specifications | 97 | 6.0% |
| Improper product selected for patient | 97 | 6.0% |
| Improper ABO or Rh type selected for patient | 92 | 5.7% |
| Unit issued from the blood bank to wrong patient | 62 | 3.8% |
| Unit released prior to obtaining current sample for ABO, Rh, antibody screen and/or crossmatch testing | 50 | 3.1% |
| Required testing not performed or documented for: | 181 | 11.2% |
| Antigen screen | 50 | 3.1% |
| Antibody screen or identification | 46 | 2.8% |
| Compatibility | 36 | 2.2% |
| Distribution of product that did not meet specifications:: | 180 | 11.1% |
| Product with unacceptable, undocumented, or incomplete product QC | 115 | 7.1% |
| Bacterial Detection Testing | 86 | 5.3% |
| Outdated product | 32 | 2.0% |
| Product in which i nstrument QC or validation unacceptable or not documented | 16 | 1.0% |
| Required testing incomplete or positive: | 33 | 2.0% |
| Antibody screen or identification | 16 | 1.0% |
| Compatibility | 5 | 0.3% |
| Shipping and storage | 22 | 1.4% |
| Product not packaged in accordance with specifications | 6 | 0.4% |
| Stored at incorrect temperature | 5 | 0.3% |
Of the 3,897 reports submitted by unlicensed blood establishments, 1,052 (27%) involved labeling deviations and unexpected events.
Most Frequent BPD Reports - Labeling
From Unlicensed Blood Establishments
Table 17
| LABELING (LA) 1,052 | # Reports | % of Total LA |
|---|---|---|
| Crossmatch tag or tie tag labels incorrect or missing information | 467 | 44.4% |
| Recipient identification incorrect or missing | 199 | 18.9% |
| Crossmatch tag switched, both units intended for the same patient | 87 | 8.3% |
| Unit or pool number incorrect or missing | 49 | 4.7% |
| Crossmatch tag incorrect or missing | 27 | 2.6% |
| Expiration date or time extended or missing | 22 | 2.1% |
| Unit ABO and/or Rh incorrect or missing | 21 | 2.0% |
| Blood unit labels | 276 | 26.2% |
| Extended expiration date or time | 120 | 11.4% |
| Donor number or lot number incorrect or missing | 43 | 4.1% |
| ABO and/or Rh incorrect | 36 | 3.4% |
| Product type incorrect | 20 | 1.9% |
| Transfusion record (crossmatch slip) incorrect or missing information | 309 | 29.4% |
| Recipient identification incorrect or missing | 70 | 6.7% |
| Transfusion record switched, both units intended for the same patient | 57 | 5.4% |
| Unit or pool number incorrect or missing | 53 | 5.0% |
| Product type incorrect or missing | 26 | 2.5% |
| Expiration date or time extended or missing | 26 | 2.5% |
Of the 3,897 reports submitted by unlicensed blood establishments, 530 (13.6%) reports involved post donation information.
Most Frequent BPD Reports - Post Donation Information
From Unlicensed Blood Establishments
Table 18
| POST DONATION INFORMATION (PD) 530 | # Reports | % of Total PD |
|---|---|---|
| Behavior/History | 444 | 83.8% |
| Travel to malaria endemic area/history of malaria | 171 | 32.3% |
| Risk factors associated with Creutzfeldt-Jakob Disease (CJD) - travel | 98 | 18.5% |
| History of cancer | 25 | 4.7% |
| Illness | 70 | 13.2% |
| Post donation illness (not hepatitis, HIV, HTLV-I, STD, or cold/flu related) | 44 | 8.3% |
| Post donation diagnosis of cancer | 24 | 4.5% |
| Testing* | 16 | 3.0% |
* Includes: tested positive for viral marker either prior to or post donation
Of the 3,897 reports submitted by unlicensed blood establishments, 391 (10%) reports involved routine testing deviations and unexpected events.
Most Frequent BPD Reports - Routine Testing
From Unlicensed Blood Establishments
Table 19
| ROUTINE TESTING (RT) 391 | # Reports | % of Total RT |
|---|---|---|
| Incorrectly tested for: | 269 | 68.8% |
| Compatibility | 85 | 21.7% |
| Antibody screening or identification | 83 | 21.2% |
| Antigen typing | 29 | 7.4% |
| Rh | 28 | 7.2% |
| ABO | 22 | 5.6% |
| Sample (used for testing) identification | 83 | 21.2% |
| Sample used for testing was incorrectly or incompletely labeled | 63 | 16.1% |
| Unsuitable sample used for testing (e.g., too old) | 10 | 2.6% |
| Incorrect sample tested | 9 | 2.3% |
| Reagent QC unacceptable or expired reagents used | 39 | 10.0% |
| Antibody screening or identification | 16 | 4.1% |
| Antigen typing | 7 | 1.8% |
| ABO | 6 | 1.5% |
II. C. Most Frequent BPD Reports Submitted by Transfusion Services
Of the 1,517 reports submitted by transfusion services, 727 (47.9%) reports involved quality control and distribution deviations and unexpected events.
Most Frequent BPD Reports - Quality Control & Distribution
From Transfusion Services
Table 20
| QC & Distribution (QC) 727 | # Reports | % of Total QC |
|---|---|---|
| Distribution procedures not performed in accordance with blood bank transfusion service's specifications | 533 | 73.3% |
| Product not documented as issued in the computer | 256 | 35.2% |
| Product not irradiated as required | 63 | 8.7% |
| Procedure for issuing not performed or documented in accordance with specifications | 34 | 4.7% |
| Improper ABO or Rh type selected for patient | 33 | 4.5% |
| Improper product selected for patient | 36 | 5.0% |
| Product released prior to obtaining current sample for ABO, Rh, antibody screen or compatibility testing | 26 | 3.6% |
| Unit issued from the blood bank to the wrong patient | 23 | 3.2% |
| Required testing not performed or documented for: | 94 | 12.9% |
| Antibody screen or identification | 24 | 3.3% |
| Antigen screen | 25 | 3.4% |
| ABO and Rh | 19 | 2.6% |
| Distribution of product that did not meet specifications: | 56 | 7.7% |
| Outdated product | 21 | 2.9% |
| Product with unacceptable, undocumented or incomplete product QC - pH for bacterial detection testing | 25 | 3.4% |
| Shipping and storage | 26 | 3.6% |
| Stored at incorrect temperature | 11 | 1.5% |
| Temperature not recorded or unacceptable upon receipt, unit redistributed | 5 | 0.7% |
| No documentation that product was shipped or stored at appropriate temperature | 5 | 0.7% |
| Product not packaged in accordance with specifications | 3 | 0.4% |
| Required testing incomplete or positive: | 17 | 2.3% |
| Antibody screen or identification | 9 | 1.2% |
Of the 1,517 reports submitted by transfusion services, 492 (32.4%) reports involved labeling deviations and unexpected events.
Most Frequent BPD Reports - Labeling
From Transfusion Services
Table 21
| LABELING (LA) 492 | # Reports | % of Total LA |
|---|---|---|
| Crossmatch tag or tie tag labels incorrect or missing information | 273 | 55.5% |
| Recipient identification incorrect or missing | 99 | 20.1% |
| Crossmatch tag switched, both units intended for the same patient | 41 | 8.3% |
| Unit or pool number incorrect or missing | 40 | 8.1% |
| Crossmatch tag incorrect or missing | 23 | 4.7% |
| Unit ABO and/or Rh incorrect or missing | 14 | 2.8% |
| Expiration date or time extended or missing | 11 | 2.2% |
| Transfusion record (crossmatch slip) incorrect or missing information | 156 | 31.7% |
| Recipient identification incorrect or missing | 45 | 9.1% |
| Unit or pool number incorrect or missing | 23 | 4.7% |
| Transfusion record switched, both units intended for the same patient | 22 | 4.5% |
| Expiration date or time extended or missing | 16 | 3.3% |
| Blood unit labels | 63 | 12.8% |
| Expiration date or time extended or missing | 29 | 5.9% |
| ABO and/or Rh incorrect | 13 | 2.6% |
| Donor number or lot number incorrect or missing | 6 | 1.2% |
Of the 1,517 reports submitted by transfusion services, 292 (19.2%) reports involved routine testing deviations and unexpected events.
Most Frequent BPD Reports - Routine Testing
From Transfusion Services
Table 22
| ROUTINE TESTING (RT) 292 | # Reports | % of Total RT |
|---|---|---|
| Incorrectly tested for: | 175 | 59.9% |
| Antibody screening or identification | 61 | 20.9% |
| Compatibility | 52 | 17.8% |
| Antigen typing | 20 | 6.8% |
| Rh typing | 15 | 5.1% |
| Sample (used for testing) identification | 83 | 28.4% |
| Sample used for testing was incorrectly or incompletely labeled | 60 | 20.5% |
| Incorrect sample tested | 14 | 4.8% |
| Unsuitable sample used for testing | 9 | 3.1% |
| Reagent QC unacceptable or expired reagents used | 34 | 11.6% |
| Antigen typing | 8 | 2.7% |
| Antibody screening or identification | 6 | 2.1% |
| Rh typing | 6 | 2.1% |
| ABO & Rh | 6 | 2.1% |
| Multiple testing | 5 | 1.7% |
II. D. Most Frequent BPD Reports Submitted by Plasma Centers
Of the 4,805 reports submitted by Source Plasma centers, 4,424 (92.1%) involved post donation information.
Most Frequent BPD Reports - Post Donation Information
From Plasma Centers
Table 23
| POST DONATION INFORMATION (PD) 4,424 | # Reports | % of Total PD |
|---|---|---|
| Behavior/History | 3,998 | 90.4% |
| Donor received tattoo within 12 months of donation | 1,579 | 35.7% |
| Donor received body piercing within 12 months of donation | 630 | 14.2% |
| Incarcerated | 330 | 7.5% |
| Risk factors associated with Creutzfeldt-Jakob Disease (CJD) - travel | 244 | 5.5% |
| Donor received ear piercing within 12 months of donation | 158 | 3.6% |
| Sex partner tested reactive for HCV | 129 | 2.9% |
| Donor received tattoo and piercing within 12 months of donation | 116 | 2.6% |
| IV drug use | 98 | 2.2% |
| Testing * | 294 | 6.6% |
| Tested reactive for HCV post donation | 91 | 2.1% |
| Tested reactive at another center, specific testing unknown | 78 | 1.8% |
| Tested reactive for HIV post donation | 76 | 1.7% |
| Tested reactive for Hepatitis B post donation | 35 | 0.8% |
* Includes testing positive for viral marker prior to or post donation
Of the 4,805 reports submitted by Source Plasma centers, 187 (3.9%) reports involved donor screening deviations and unexpected events.
Most Frequent BPD Reports - Donor Screening
From Plasma Centers
Table 24
| DONOR SCREENING (DS) 187 | # Reports | % of Total DS |
|---|---|---|
| Donor record incomplete or incorrect | 62 | 33.2% |
| Donor history questions | 42 | 22.5% |
| Arm inspection | 8 | 4.3% |
| Donor identification | 7 | 3.7% |
| Donor signature missing | 5 | 2.7% |
| Donor gave history which warranted deferral and was not deferred | 39 | 20.9% |
| Donor received tattoo within 12 months of donation | 11 | 5.9% |
| Donor received body piercing within 12 months of donation | 7 | 3.7% |
| Risk factors associated with Creutzfeldt-Jakob Disease (vCJD) - travel | 4 | 2.1% |
| Donor received vaccine or immune globulin | 2 | 1.1% |
| Donor did not meet acceptance criteria | 29 | 15.5% |
| Temperature unacceptable or not documented | 17 | 9.1% |
| Medical review or physical not performed or inadequate | 9 | 4.8% |
| Deferral screening not done | 48 | 25.7% |
| Donor previously deferred due to history | 29 | 15.5% |
| IV drug user | 6 | 3.2% |
| Deferred by another center | 3 | 1.6% |
| Incarcerated | 3 | 1.6% |
| Donor previously deferred due to testing: | 18 | 9.6% |
| Elevated for ALT | 7 | 3.7% |
| Other-unknown | 6 | 3.2% |
| Incorrect ID used during deferral search | 9 | 4.8% |
| Donor not previously deferred | 4 | 2.1% |
| Donor previously deferred due to history | 3 | 1.6% |
| Donor previously deferred due to testing | 2 | 1.1% |
II. E. Timeliness of BPD Reports
BLOOD AND PLASMA ESTABLISHMENTS
Timeliness Of BPD Reports
Number of Days From Date Discovered To Date FDA Received
Table 25
| CUMULATIVE % OF REPORTS | Licensed BB (Days) | Unlicensed BB (Days) | Transfusion Service (Days) | Plasma Centers(Days) | Total (Days) |
|---|---|---|---|---|---|
| 10% | 11 | 3 | 1 | 14 | 9 |
| 25% | 20 | 10 | 6 | 24 | 19 |
| 50% | 30 | 24 | 18 | 34 | 30 |
| 75% | 39 | 41 | 39 | 40 | 40 |
| 90% | 47 | 58 | 54 | 44 | 47 |
| # REPORTS | 28,153 | 3,897 | 1,517 | 4,805 | 38,372 |
| RANGE | 0-2738 | 0-950 | 0-893 | 1-1504 | 0-2738 |
| AVERAGE | 34 | 36 | 29 | 37 | 34 |
| # Reports lacking date discovered | 1 | 1 | 1 | 0 | 0 |
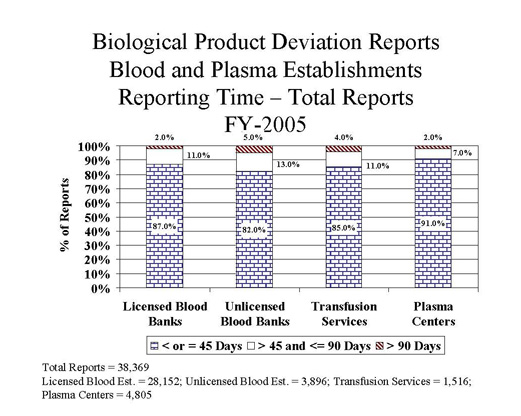
Adherence To 45 Day Required Timeframe For Reporting
(Reporting Time = Date of FDA receipt - Date of discovery of BPD)
| Reporting Time (days) | Licensed Establishments | Unlicensed Establishments | Transfusion Services | Plasma Centers | Total | |||||
|---|---|---|---|---|---|---|---|---|---|---|
| < or = 45 | 24565 | 87% | 3203 | 82% | 1281 | 85% | 4363 | 91% | 33412 | 87% |
| > 45 and <=90 | 2951 | 11% | 501 | 13% | 168 | 11% | 325 | 7% | 3945 | 10% |
| > 90 | 636 | 2% | 192 | 5% | 67 | 4% | 117 | 2% | 1012 | 3% |
| Total | 28,152 | 100% | 3,896 | 100% | 1,516 | 100% | 4,805 | 100% | 38,369 | 100% |
| *Reporting time=0 | 18 | 78 | 59 | 0 | 155 | |||||
*Reporting time = 0 - reports were submitted electronically on the day discovered.
III. FY05: BPD Reports Submitted by Manufacturers of Biological Products Other Than Blood and Blood Components (Non-Blood)
The number of reports submitted by non-blood manufacturers was approximately the same as the previous fiscal year.
Table 27
| MANUFACTURING SYSTEM | Allergenic | Derivative | In-Vitro Diagnostic | Vaccine | TOTAL | |
|---|---|---|---|---|---|---|
| Incoming Material | 0 | 9 | 4 | 1 | 14 | 3.6% |
| Process Controls | 1 | 5 | 18 | 4 | 28 | 7.3% |
| Testing | 0 | 3 | 17 | 1 | 21 | 5.5% |
| Labeling | 22 | 15 | 24 | 12 | 73 | 19.0% |
| Product Specifications | 177 | 11 | 30 | 17 | 235 | 61.2% |
| Quality Control & Distribution | 0 | 4 | 7 | 2 | 13 | 3.4% |
| Miscellaneous | 0 | 0 | 0 | 0 | 0 | 0.0% |
| Total | 200 | 47 | 100 | 37 | 384 | 100% |
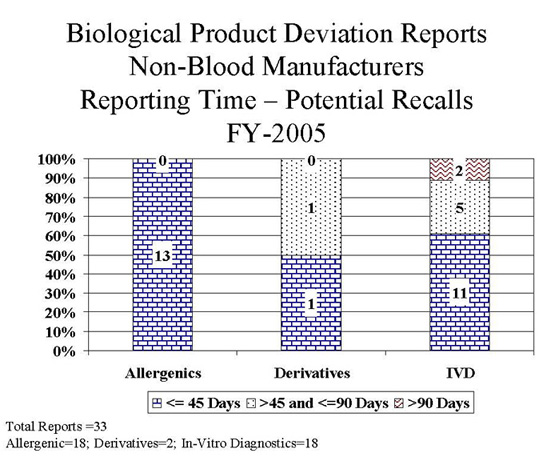
Potential Recalls By Manufacturing System
Table 28
| MANUFACTURING SYSTEM | Allergenic | Derivative | In-Vitro Diagnostic | TOTAL | |
|---|---|---|---|---|---|
| Incoming Material | 0 | 1 | 1 | 2 | 6.1% |
| Process Controls | 0 | 1 | 1 | 2 | 6.1% |
| Testing | 0 | 0 | 0 | 0 | 0.0% |
| Labeling | 9 | 0 | 2 | 11 | 33.3% |
| Product Specifications | 4 | 0 | 12 | 16 | 48.5% |
| Quality Control & Distribution | 0 | 0 | 2 | 2 | 6.1% |
| Miscellaneous | 0 | 0 | 0 | 0 | 0.0% |
| Total | 13 | 2 | 18 | 33 | 100% |
NON-BLOOD MANUFACTURES
Timeliness of BPD Reports
Number Of Days From Date Discovered To FDA Received
Table 29
| CUMULATIVE % OF REPORTS | Allergenic (Days) | Derivative (Days) | In-Vitro Diagnostic (Days) | Vaccine (Days) | TOTAL (Days) |
|---|---|---|---|---|---|
| 10% | 6 | 27 | 28 | 21 | 9 |
| 25% | 13 | 35 | 37 | 36 | 20 |
| 50% | 22 | 44 | 43 | 42 | 35 |
| 75% | 35 | 82 | 57 | 55 | 44 |
| 90% | 43 | 418 | 141 | 369 | 82 |
| # REPORTS | 200 | 47 | 100 | 37 | 385 |
| RANGE | 0-196 | 6-737 | 12-722 | 11-761 | 0-761 |
| AVERAGE | 27 | 123 | 72 | 105 | 58 |
| # Reports lacking date discovered | 0 | 0 | 1 | 0 | 1 |
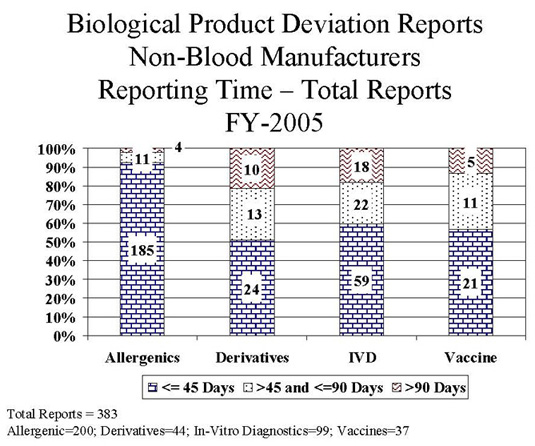
Adherence To 45 Day Required Time For Reporting
(Reporting Time = Date of FDA receipt - Date of discovery of BPD)
| Reporting Time (days) | Allergenics | Derivatives | In-Vitro Diagnostics | Vaccines | Total | |||||
|---|---|---|---|---|---|---|---|---|---|---|
| < or = 45 | 185 | 92% | 24 | 51% | 59 | 60% | 21 | 57% | 289 | 75% |
| > 45 and <=90 | 11 | 6% | 13 | 28% | 22 | 22% | 11 | 30% | 57 | 15% |
| > 90 | 4 | 2% | 10 | 21% | 18 | 18% | 5 | 13% | 37 | 10% |
| Total | 200 | 100% | 47 | 100% | 99 | 100% | 37 | 100% | 383 | 100% |
| *Reporting time=0 | 1 | 0 | 0 | 0 | 1 | |||||
*Reporting time = 0 - reports were submitted electronically on the day discovered.
Attachments