Thanks to Peggy and What’s Next for the GLOBE Chief Scientist Blog?

April 24th, 2009

(From Ed Geary, Director of GLOBE)

On behalf of GLOBE staff and UCAR, it is my very great pleasure to thank Dr. Margaret (Peggy) LeMone for both her wonderful Blogs and for all of her other contributions to GLOBE during the past five years. As GLOBE’s Chief Scientist, Peggy has been an inspiration to all of us here at the GLOBE program office. She is a true scientist, dedicated to understanding how our planet works. Peggy has an insatiable curiosity about Earth and the rare ability to make science understandable and fun for students of all ages. I hope you all have enjoyed reading Peggy’s Blogs as much as we have.

With Peggy leaving GLOBE, you may be wondering what will happen to this Blog? The good news is that the Blog will go on but the format is changing to include Blogs from a variety of NASA, NCAR and other scientists — and “yes”, we have already asked Peggy to consider contributing at least a few guest Scientist Blogs in the future.

Introducing our new NASA-GLOBE Scientists

We are very excited to announce that several outstanding NASA scientists will be working closely with GLOBE over the next five years. These scientists include: Dr. Lin Chambers from NASA’s Langley Research Center in Hampton, Virginia, and Dr. Charles Ichoku, Dr. Charles Gatebe, and Dr. Robert Cahalan from the Goddard Space Flight Center in Greenbelt, Maryland. They will be introducing themselves to you all in this Blog, plus they are already working on the next set of GLOBE Science Blogs. We anticipate additional scientists contributing to this Blog as we plan and implement the upcoming Student Research Campaign on Climate (2011-2013). So stay tuned, as you never know who will show up as our next GLOBE Scientist-Blogger.

Please keep in mind, that our new GLOBE Scientists will each bring their own unique Blogging style to GLOBE. Think about your favorite teachers. They can be very different from one another and still be good. Your favorite teachers, Peggy, and our future bloggers — all want to share with you the excitement that comes from studying the environment. So please share your comments, ideas, and questions with them and make them feel welcome.

New NASA-GLOBE Scientist Introductions

Dr. Lin Chambers: NASA Scientist for GLOBE Student Research Campaign on Climate

nasa_sci_intro_fig1.jpg

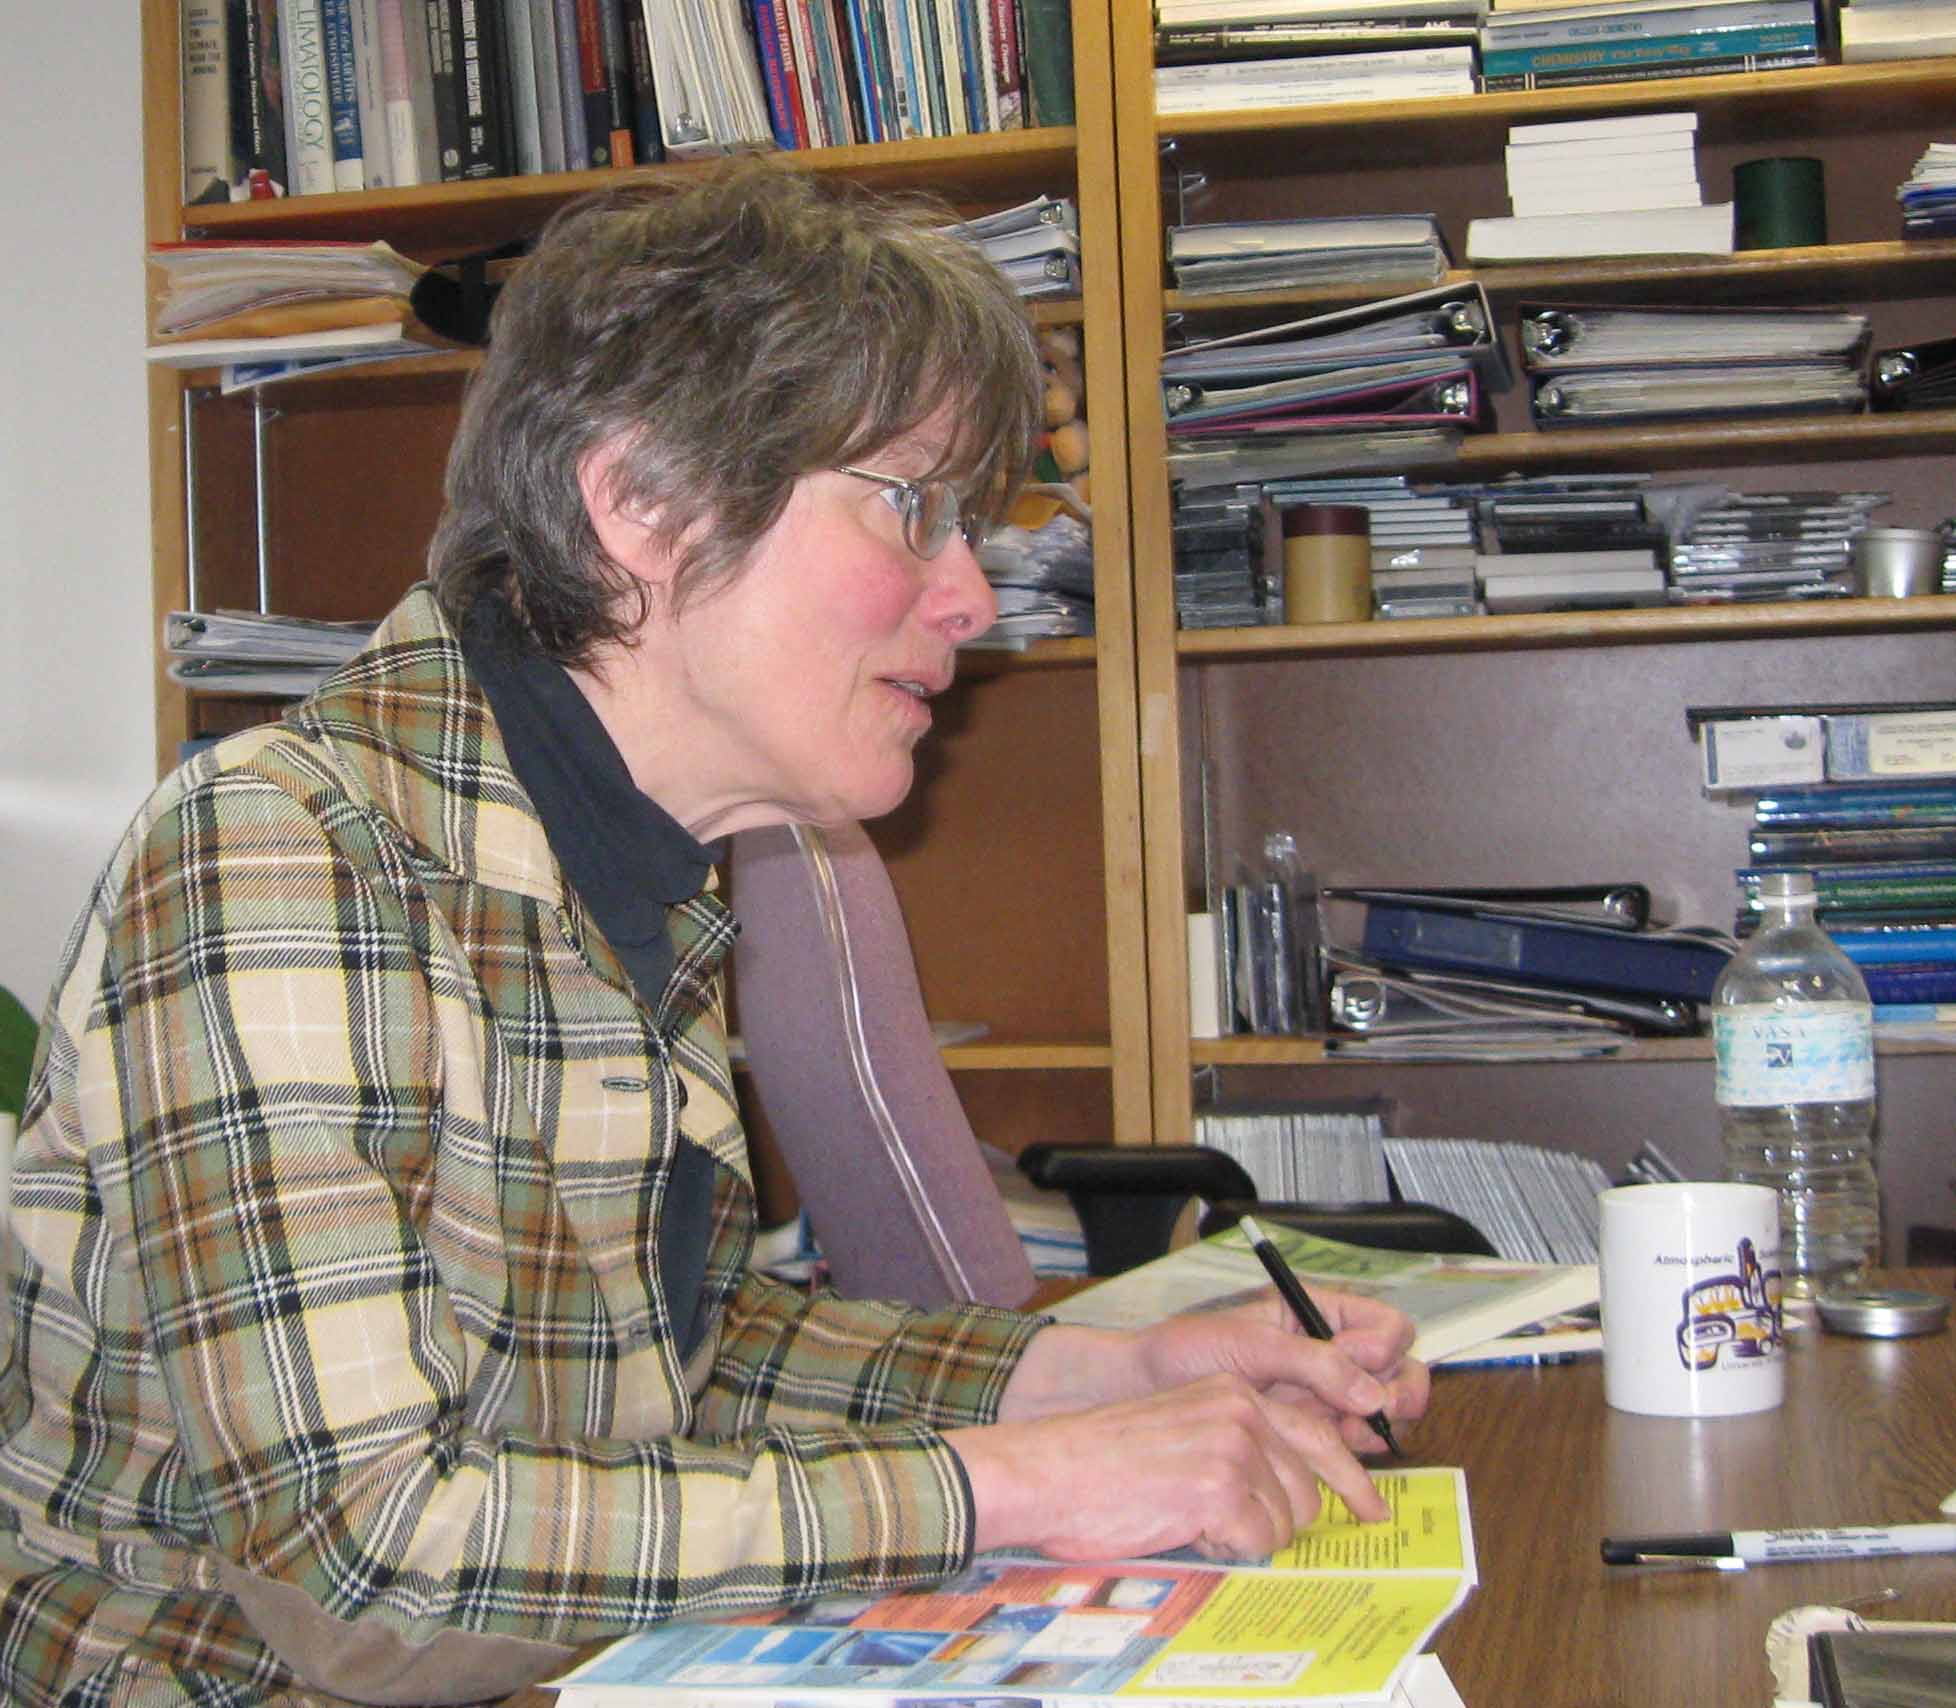
Figure 1. Dr. Lin Chambers giving a presentation to a teacher workshop in 2007.

I am a Physical Scientist at NASA Langley Research Center in Hampton, Virginia. That’s in southeastern Virginia — near Virginia Beach if you’re a beach lover; near the Jamestown–Williamsburg–Yorktown Historic Triangle if you’re a history lover; and near the edge of an ancient impact crater at the mouth of the Chesapeake Bay (Figure 2) if you’re interested in meteors, comets, crabs, sailing, or underwater aquatic vegetation. I’ve been working here for over 25 years, starting out as a Co-operative Education student while I was still in college at Rensselaer Polytechnic Institute. My studies were in aeronautical engineering, so I began my career as an aerospace technologist studying how spacecraft interact with the atmosphere as they approach a planet (re-entering Earth’s atmosphere or going to Mars). I earned a PhD in that field from North Carolina State University in 1991. After about 10 years in that field I switched my focus to the atmosphere itself.

nasa_sci_intro_fig2.jpg

Figure 2. NASA Langley is located at about 8 o’clock in the circle showing the ancient impact crater at the mouth of the Chesapeake Bay, the largest estuary in the United States (Image credit: http://marine.usgs.gov/fact-sheets/fs49-98/)

As a physical scientist, my role is to study the science of the physical world around us. My primary interest is a wispy portion of the physical world: clouds. My work has been involved with understanding how clouds interact with sunlight and infrared radiation (heat) to help control the climate of the Earth; how clouds may be changing under the influence of climate; and what such changes in clouds might mean for Earth’s future climate. My work is part of a large team of scientists — the Clouds and Earth’s Radiant Energy System (CERES) team — that is studying this problem. One of my roles on this team has been to involve students from around the world in helping us understand this puzzle, by making and reporting local observations of clouds at the time that our satellite instruments pass over their location on Earth. This is called ground truth, and we compare these reports to what our satellite reports at that time and place to try to better understand what is going on. I am looking forward to being involved with GLOBE over the next several years to expand student involvement in understanding our home planet, Earth.

Dr. Charles Ichoku (Charles I): NASA Scientist for GLOBE Student Research Campaign on Climate

nasa_sci_intro_fig3.jpg

Figure 3. Dr. Charles Ichoku in the midst of sun-photometers measuring atmospheric aerosols by ground-based remote sensing at the AERONET (http://aeronet.gsfc.nasa.gov/) home base at NASA Goddard Space Flight Center, Greenbelt, Maryland, USA.

I am an Earth scientist in the Climate and Radiation Branch within the Earth Sciences Division at NASA Goddard Space Flight Center, Greenbelt, Maryland, USA. I grew up in Nigeria, where at a young age my elementary school education was interrupted in the 4th grade by a civil (Biafra) war, which raged from 1966 to 1970. During that time, my family moved from one rural village to another, trying to escape the war and to survive from day to day, and I had no time to think about school. At the end of that period, I resumed my education under difficult socio-economic circumstances. Although, I often came across the names of such famous early scientists as Newton, Faraday, and others in my science classes, and was impressed by their great discoveries, I did not see any prospects of becoming a scientist myself. However, one desire I have always had since my childhood has been to live in a clean well-planned environment that is carefully nurtured continuously to provide comfort and security for life to thrive. Therefore, I made a decision to always contribute to the best of my ability in realizing this ideal. Thankfully, I did well in mathematics and the different science subjects during my school days, had great parents who worked extremely hard to see their children succeed in life even though they themselves did not have formal education beyond the third grade, and have an awesome Father in Heaven who has been providing excellent opportunities for me.

When I was applying to the University, although I had several opportunities to study any subject I wanted, I chose to pursue a major in Surveying, which is defined in Wikipedia as: the “technique and science of accurately determining the terrestrial or three-dimensional space position of points and the distances and angles between them”. I made this choice in order to participate actively in the science of planning environmental development, determining spatial relationships between various natural and man-made features, and mapping them, so that human society could accurately keep track of our environmental resources as development advances. During the first year of my undergraduate studies at the University of Nigeria, Enugu Campus, I heard about the great achievements of NASA in sending satellites to space to monitor the earth, and even heard from some of our fellow students that our then department Chair had been involved in some NASA projects during and after his graduate studies in the USA. I thought about how cool it must be to work for NASA, but never dreamed that I could have such a glorious opportunity in a million years. In any case, something I have always been determined to do is work diligently at whatever professional activity I find myself involved in, with the goal of achieving optimum success.

Following my graduation from college, and given my great interest to join in the effort of monitoring and protecting the environment, and my desire to work with satellite data, I chose to pursue my graduate studies in the field of remote sensing, defined in Wikipedia as “the small or large-scale acquisition of information of an object or phenomenon, by the use of either recording or real-time sensing device(s) that is not in physical or intimate contact with the object (such as by way of aircraft, spacecraft, satellite, buoy, or ship)”. Shortly after I received my Masters degree, a friend brought to my attention an announcement of scholarship offered by the French government to those wishing to pursue their PhD in France. I applied and was one of those selected. I spent six years studying in France, and finally received my PhD in Earth Sciences from the Université Pierre & Marie Curie, Paris. Thereafter, I was offered the opportunity to do my postdoctoral research at the Jacob Blaustein Institute for Desert research, Sede Boker, Israel, where I spent four memorable years. Then I worked as a visiting scientist at the Max-Planck Institute for Chemistry, Mainz, Germany for a little over a year, before the unthinkable opportunity came in 1998 for me to work at NASA.

Over the years, I have been involved in developing and applying both experimental and remote sensing approaches to research various branches of the earth and atmospheric sciences. However, during the last decade, my research focus has been on the study of tiny particles suspended in the atmosphere (known as aerosols), which include dust blown by wind from Earth’s surface, smoke emitted from forest fires and other open biomass burning, as well as pollutants from industries and other human activities. I am studying the mechanisms responsible for the generation of these aerosols, particularly smoke and dust, and their sources, distribution, and impacts on air quality, human health, and climate.

When this opportunity to be a GLOBE scientist came up recently, I received it with great enthusiasm because of the prospect of helping the young generation to learn to utilize the vast amounts of observations and data from satellite and other sources for the benefit of our environment. Therefore, I am looking forward to working together with all of the talented students, motivated teachers, and great scientists and colleagues participating in GLOBE, as well as visionary members of the world community, in many exciting projects geared toward protecting our home planet from rapid degradation, and nurturing it carefully to provide much needed comfort and security for the enjoyment of life by us and future generations.

Dr. Charles. Kironji Gatebe (Charles G.): NASA Scientist for GLOBE Student Research Campaign on Climate

nasa_sci_intro_fig4.jpg

Figure 4: Dr. Gatebe at NASA Ames Research Center in California, USA on June 22, 2008 after a research flight on NASA P-3B aircraft (in the background). Picture by Rajesh Poudyal, SSAI/NASA GSFC.

I am an atmospheric scientist whose journey began in a small impoverished village in Central Kenya in mid-sixties, where my parents eked out a living from coffee plantations owned by European farmers. They earned less than $10 US dollars a month. I became attracted to reading at an early age and had to walk 10 km bare feet to and from school each day. I survived on one meal a day for nine years in pursuit of a good education. In high school I led other students in developing innovative science and technology projects, winning prizes at Kenya National School Congresses. I also led the Wildlife club in the school which was involved in wildlife conservation, where Kenya is a world leader. While attending the University of Nairobi in late 80s to early 90s, I walked the streets of Nairobi to measure pollution from motor vehicles and developed simple models for predicting pollution levels based on number of vehicles crossing any point in an hour and their average speed. My investigations on how much pollution is generated locally and how much is transported from other countries led me to take measurements on the top of Mount Kenya (>14000 feet). Having measurements for this high altitude, allowed me to separate local from region pollution and to relate episodes of peak pollution and dust concentration to air transport from the source regions in southern Africa, the Sahara desert and the Indian subcontinent. In 2000, I was fortunate enough to be recognized for these studies by receiving the Young Scientist Award from the World Meteorological Organization.

In the last 10 years, I have been working at NASA Goddard Space Flight Center as a research scientist with the Goddard Earth Sciences and Technology Center of the University of Maryland, Baltimore County. I now study interaction between light and natural surfaces such as vegetation, ocean, clouds, and pollution using airborne measurements to help improve their detection from space using satellites. I have flown on many NASA aircraft missions to validate satellite measurements in southern Africa, US East Coast over the Atlantic Ocean, US West coast over the Pacific Ocean, Alaska, Greenland and Canada. I am currently the lead investigator of NASA’s Cloud Absorption Radiometer (CAR), which is flown aboard NASA P-3B aircraft.

I received my Bachelors degree (B.S. in meteorology, mathematics, and physics) and my Masters (M.S. in meteorology) degree from the University of Nairobi, Kenya, in 1990 and 1994, respectively. I received my Ph.D. degree in atmospheric sciences from the University of the Witwatersrand, South Africa, in 1999. For a brief period in 1995, I worked as a research meteorologist at the Kenya Meteorological Department and then joined the University of Nairobi from 1995-1999, where I taught courses in air pollution using nuclear related techniques at the Institute of Nuclear Science. I came to NASA Goddard Space Flight Center in 1999 as a Resident Research Associate of the Universities Space Research Association (USRA).

nasa_sci_intro_fig5.jpg

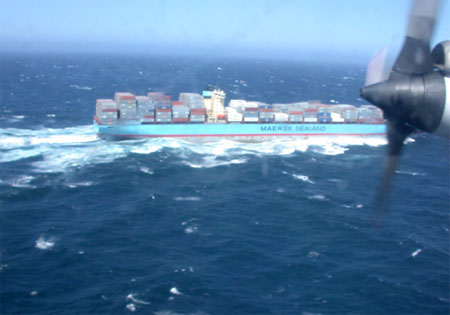
Figure 5: NASA P-3B following ship plumes over the Pacific Ocean off California coast on June 24 2008. The aircraft was equipped with instruments to measure ship pollution and radiation to help determine the types of chemicals emitted from these large marine vessels and the impact of these chemicals to air quality in California. The flight was coordinated with NASA satellites, which measures pollution from space. Picture by C.K. Gatebe.

I currently serve on the Scientific and Technical Advisory Panel to the World Bank/United Nations Environment Programme Global Environment Facility (GEF) Roster of Experts on climate change.

Dr. Robert (Bob) Cahalan: NASA Scientist for GLOBE Student Research Campaign on Climate

nasa_sci_intro_fig6.jpg

Figure 6: Dr. Bob Cahalan

I am Bob Cahalan, Head of NASA Goddard’s Climate and Radiation Branch. I hold several jobs related to climate change, and have been doing science research for more than 40 years. As you will soon learn, I love science and I love building scientific instruments and using them to discover how the universe works.

My scientific journey began in Ohio, where I grew up in two small towns, Delaware and Miamisburg. I first discovered my love of nature in the surrounding farmlands. In secondary school I built a spirometer to measure lung capacity, and won an award at a local science fair. In college two friends and I built a plasma jet that heated air to over 1000 degrees Kelvin. It was powered by several car batteries connected in series. It generated a current too large to measure with an ammeter, as that high a current would melt any ammeter. I was still able to measure the current indirectly, from the magnetic field it produced, holding a magnetometer above the wires. During my last two years in college I did electron paramagnetic resonance research, learning about crystals and building a microwave system with a 10,000 gauss magnet purchased with funds from a National Science Foundation grant. Interpreting the data from that system needed basic understanding of quantum phenomena. Wondering about weird quanta soon led me to do physics graduate study at the University of Illinois. There I published papers on subatomic particles, explaining how the proton, that make up the nucleus of atoms, is made from simpler pions, and predicting a “heavy” particle of light, like the known photons, but 80 times heavier, called the Z. My prediction was confirmed 20 years later when particle accelerators became powerful enough to produce Zs. The university awarded me a PhD in physics.

More important, during this time I married Margaret Werner, whom I’d met in college. Our first son Joel was born in Illinois. I continued my work on particle physics as a Professor at Syracuse University in New York, with side trips to research centers in Aspen, Colorado, and in Warsaw, Poland. Our second son, Gabriel, was born in Poland in 1975.

My interest in astronomy grew, as every night I used Syracuse University’s 100 year-old 8-inch refractor telescope. To pursue astronomy, I joined the faculty at Western Kentucky University, using a 16-inch telescope on the roof of the physics building, and an adjacent planetarium, and I taught astrophysics. I began to think about Earth as a planet, and spent a summer at the National Center for Atmospheric Research, NCAR, one of the premier centers for studying Earth’s atmosphere, in Boulder, Colorado. After a year teaching meteorology and fluid dynamics at the University of Missouri in Saint Louis, I returned for another year at NCAR, and began to focus on clouds, using NASA’s Landsat satellite to measure them. In 1979 I joined NASA Goddard, and have continued cloud research for 30 years.

Clouds are endlessly fascinating for their many complex and beautiful properties, and important for Earth’s climate because they control the flow of energy in the atmosphere, and the supply of energy to the oceans. At Goddard I designed a laser system with multiple views, like a bee’s eye, showing that it can see through clouds to measure their thickness, naming it THOR, for “Thickness from Offbeam Returns.” I have flown THOR over Oklahoma, Central America, and Antarctica, measuring clouds, ice, and snow. I discovered that clouds have an “effective thickness” depending on their “fractal” properties, an idea now used in global climate models.

I now study how the Sun influences Earth, and how past changes in the Sun can be measured in the Moon’s temperature, a few meters beneath the surface, in the “regolith” or dust layer. With my son, I have also published a paper on “chaotic rhythms of a dripping faucet” finding similar beauty and complexity in leaky faucets as in clouds. My wife Margaret and I founded “CHEARS” whose project “The Earth Squad” helps students observe and improve their environment, especially the air they breathe, and the water they drink.

Farewell

March 31st, 2009

This is my last blog as GLOBE Chief Scientist. I have greatly enjoyed sharing my thoughts with you. I have enjoyed hearing from many of you, not only through comments on the blog, but through emails, phone calls, and encounters at meetings. This blog enabled Kevin Czajkowski to keep in touch with teachers and students during the two surface temperature web-based field campaigns held in December of 2007 and 2008, with a quick-follow through showing students and teachers how the data were used. This, I hope, will be a model for GLOBE web-based field campaigns in the future. The blog was used by SCUBAnauts to share their experiences. The blog was used by GLOBE teachers in the classroom. My favorite blogs were those that I could use to share data with you, in hopes that you could work with the data – and perhaps collect some data on your own.

Science is – more than anything – about asking questions about Nature. And it’s a lot more fun to discover the answers from your own data, than to read about them in a book. It doesn’t matter that someone else found the answer earlier. It’s important for you to find out how to discover nature’s secrets on your own.

I already knew about the relationship between crickets and temperature. But it was tremendously satisfying to re-discover that for myself. (Do you remember the cricket blog?)

One message that I hope you have heard is that you can do some simple science investigations without many tools. You can do some simple investigations without buying expensive equipment. The cricket measurements can be made with a clock and a thermometer. You can take snow measurements with a ruler. Does the snow cover vary from one place to another? With time? You can test to see if the auditorium heats up when you fill it up for parents’ night or a special performance or speech. The instruments needn’t be expensive. Even an uncalibrated thermometer can tell you whether it gets warmer in the auditorium, for example.

Another message that I would like to leave with you is not to be afraid to ask questions. Your textbook might not be right. When I was just starting out as a researcher, my professor told me to take a textbook, open it up, and point to a random page. He said that something on the page was probably wrong in some way, and it was my job to find out. That’s the way science is. We keep learning. A fundamental part of that learning is carefully observing nature.

I feel extremely lucky to have seen the science related to greenhouse-gas warming of the Earth develop from a simple idea I first heard in the 1970s to an idea that is largely accepted by the scientific community today. I also feel lucky to have seen geologists accept continental drift. The process of scientific progress, as you may have seen from arguments in the media, is not always pleasant. It can even be painful. People have passionate opinions on both sides. I just received a long and somewhat desperate paper from a long-time friend and colleague who still doesn’t accept that human-generated greenhouse gases are responsible for the warming of the planet. But there is considerable evidence from observations and models that he is wrong.

Others who know less about science or who don’t want to accept the warming of the planet by us write things on the Web that can be easily exposed as false. Thus I have from time to time written about “misconceptions” about climate change. When you read about the changing climate – or any other aspect of nature – on the Web or in newspapers or magazines, remember your basic science. And remember to ask questions.

I have probably been less successful in writing about other countries. Writers are told to write about what they know – and I know the weather and climate of the United States the best, since I live here. I can observe the temperatures and puddles and snow and fires in Boulder, Colorado, because I live here. Perhaps in future blogs we can have guest bloggers from other countries to share observations and ideas.

What will be my future?

After I leave GLOBE, I will be a full-time scientist at the National Center for Atmospheric Research. I will be doing research on how to represent the warming and moistening of the atmosphere by the surface and its vegetation in computer models used to predict the weather and climate. The plot in Figure 1 shows something I am interested in: how daytime surface temperature (related to how much the air near the surface is heated) and green plant density. Figure 2 shows where the data were collected.

tracks_ndvivsts_figoneframe.gif

Figure 1. Plot of the Normalized Differential Vegetation Index (NDVI), which describes the amount of green plants in a given area, against surface temperature measured by a Heiman radiometer. On the Eastern Track, which is in southeast Kansas, areas with lots of green (in this case grass) tend to be cooler, something we know from walking barefoot. On the western track (in the Oklahoma Panhandle), the surface temperature depends more on how wet the ground is than on vegetation, which is sparse. (For more about surface temperature, see the GLOBE Teachers’ Guide) The data were collected from the University of Wyoming King Air, flying along tracks shown in Figure 2, on 29 May 2002 (Western Track), 30 May 2002 (Eastern Track) and 31 May 2002 (Central Track). IHOP = International H2O Project.

ihopflighttracks2color-copy.jpg

Figure 2. Map showing the locations of the flight tracks in Figure 1. The “Radar Track” in this Figure is the “Western Track” in Figure 1. The low NDVI in Figure 1 tells us there is little green vegetation along the radar (western) track. This is consistent with less rain there.

After a short break, I will continue to contribute (though less frequently) to a blog at another site here at the University Corporation for Atmospheric Research (UCAR, to be announced later). I hope you will continue reading the GLOBE blog, which will be undergoing some exciting changes. These will be announced in the next blog by Dr. Ed Geary, the GLOBE Director.

I will be retiring on 25 December 2009. But I will still be working – more for the joy of it rather than for pay. Younger people can use the salary more than I can. I am looking forward to serving as President of the American Meteorological Society, which has 14,000 members around the world, but mostly in the United States and Canada (I am currently President-Elect). I also will be continuing in my weather and climate research, but will also take more time for my other passions – paleontology (Figure 3), birding (Figure 4), and clouds (Figure 5), as well as my family and friends.

baculite.jpg

Figure 3. Segments of a Baculite. This fossil is a type of Ammonite that is straight rather than coiled. It is related to the modern Chambered Nautilus or Squid. From the Upper Cretaceous, Wyoming.

turkey.jpg

Figure 4. Wild Turkey, photographed on road from Roswell, NM, USA, to Bitter Lake National Wildlife Refuge.

cuovervacantlotsat12ma.gif

Figure 5. Cumulus clouds over the foothills west of Boulder, Colorado.

Please remember the joy that comes with observing your world. But look carefully. And remember that nature is full of surprises.

Peace

A Day in the Life of a Scientist

March 10th, 2009

Have you ever wondered what it is like to be a scientist? Or the GLOBE Chief Scientist? I do both. My days are sometimes a challenge, since the two jobs are very different. What are these jobs like? Below is described a day that was so richly varied that I thought it would be fun to share it with you.

My husband and I start each day with a 2-mile walk at dawn, during which we observe the animals (deer, foxes, birds), talk, or just walk quietly. I think of many of my blog ideas while on this walk (or on the occasional walks I take on the open space near the office).

After we eat breakfast, we carpool to work. Since we work in two different buildings, he lets me off about 200 meters from where I work and then he drives to his building, which has covered parking. While walking to my building, I take special note of the birds (the other day a hawk and crow flying together) or clouds, sometimes pausing to take a picture. This walk takes me right by the rain gauge that NCAR has as a part of the CoCoRaHS that I have written about before. Sometimes I see someone taking the rainfall measurement.

After arriving at the office, I plug in my laptop (if I took it home overnight) and turn it on. While waiting for it to boot, I turn on my desktop computer and read my email. I was excited to see some comments about a paper that five of us just finished on tropical storm clouds carrying energy from near the surface to 10-14 kilometers and higher. The sender showed me and the other authors a couple of figures that showed the effects of the model resolution (related to the size of motions that the model can deal with directly) on how far air can rise in a cloud model. (A cloud model is designed to predict what the clouds will do). The most exciting thing about this particular paper is that we worked on it almost completely over the Internet. We rarely met in person (though some met at conferences and at the University of Oklahoma). The only person involved that I talked to (over the phone) was the lead author – and that was only once!

figure_1_peggy_desk1.jpg

Figure 1. At my desk. Here, I’m reviewing a cloud poster that will be presented at a meeting this weekend.

By the time I finished reading the comments on the paper, a colleague (Dr. Fei) came in to tell me about a meeting he had attended the previous day. He told me that the group liked some of the work we had been doing over the past two years on altering the formulas in a model used to represent surface exchanges of heat and moisture in a numerical weather prediction model used for weather forecasting and research. We were going to be asked to present the results to a meeting in April. We talked about what we needed to do for this presentation, and some of the other tasks we were working on together. We will be doing a lot of comparison of the model results to observations. Once we are satisfied that our new version of the model (with the adjusted formulas) is better than the old one, we will change the old one, so that everyone using the model can benefit from what we found out.

After that, it was time for some GLOBE work.

We are working on a way to more easily access scientists when we need them for special events, like Web chats, video conferences, or judging student papers. Another GLOBE staffer (Dr. Sheila) and I had worked on this for a couple of years, getting input from the GLOBE community at the US Globe Annual Meeting in San Antonio, and a meeting for GLOBE and its Science Principal Investigators in Durham, New Hampshire. This morning, I finished writing a document that will be discussed next week. I sent a copy to Dr. Sheila to review before we shared it with others.

I then did some work on the next blog (on birds), looking at the first review that came in, and altering the blog in response to the comments. Each blog has three or four reviewers from the GLOBE staff, and occasionally a scientist outside of GLOBE looks at it if the blog is on a subject that I’m not an expert on; and sometimes even if I am.

Checking email, I discovered I needed to write another letter of recommendation for a young post-doc (someone with a short-term position – usually 1-2 years – right after they get their doctorate) who is looking for a university faculty job. I gathered the needed information, sent the letter as an email, and printed it out for mailing using snail mail, as they requested. I discovered that I needed to write a second letter for the same person, so I did.

By this time, it was time for lunch, so I went downstairs to the NCAR Cafeteria for about a half an hour. We talked about birding on this particular day (maybe because I had questions related to my bird blog). I stopped on the way back to the office to put a piece in a jigsaw puzzle outside the Director’s office. For years, there has been a jigsaw puzzle there for people to work on at odd moments of the day (for me, while waiting for something to come out of the printer, coming back from lunch, or between tasks – just to get up from my desk).

figure_2_peggy_puzzle_1.jpg

Figure 2. Working on the jigsaw puzzle – this one is basically done.

By the time I got back to my computer, some figures had arrived over the Internet for a paper that we just finished. There are several authors on this paper, because it deals with data that several of us collected in a field campaign in 2002. Each of the authors is reviewing it; and in the meantime, we are refining the figures and fixing minor things we know that are wrong. Dr. Fei is one of the authors. I checked each of the figures, saved them, and inserted them into the manuscript. I compared the captions to the figures, but found that no adjustments were necessary.

Then more emails arrived related to the paper on tropical clouds. This time the lead author had averaged the temperature in the updrafts that had reached 10-14 kilometers in altitude. We exchanged a few messages about whether the averaging time should be shorter than what he was using.

Dr. Sheila had reviewed my document and made several suggestions, which I considered and responded to before emailing it to several GLOBE staffers for a meeting next week.

By this time, it was almost 2:00 p.m., and I needed to post another blog for Dr. C. He sent me an email telling me it was coming, and I sent an email to Karen in GLOBE to stand by for whatever changes she would need to make. The blog arrived at about 1:50 p.m. I checked it for edits, and posted it after altering one figure slightly in Photoshop. There were some concerns about the other figure, however, and I noted that when I let Karen know the blog was posted. I also let Dr. C. know – and checked with him to make sure that he meant millimeters (rather than centimeters) in one part of the blog. He emailed back that he meant millimeters. I discovered the problem with the figure, cropped it, and sent the resulting image to Karen to put in the blog.

After all of this, I headed to a 2:00 p.m. meeting 20 minutes late, and discovered that everyone was coming back. Given this new-found freedom, I put another piece of the puzzle, and organized things for my trip home. When my husband arrived just after 3:00 p.m., several of us talked about the meeting and how NCAR could be saving money.

At 3:15, I went home, and then set up my computer to write a letter of recommendation for a student who is getting his Ph. D. in 2009. I finished at 5:00 p.m.

What have you noticed about this day?

Did you notice how much time I spent writing? And I wasn’t really working on the paper very much. This is not unusual – scientists spend a lot of time writing.

Also – did you notice how much time I spent on the Internet? I am currently working on two papers, and finished one last week. In all cases, the authors are scattered across the country. We hope that more GLOBE students will work together in this way.

Finally, I use math frequently – even simple stuff like averaging. Analyzing weather observations involves math. The models involve a lot of math, including a formula we were working on changing. Finally, analyzing the model output involves math.

Of course physics (and for me a little biology and chemistry) is important as well. The math and writing and Internet are all tools that help with science.

Some days are of course, different. For example, to collect data in field campaigns, we have to go where the weather is. Over my career, I’ve lived in several places – Dakar, Senegal; Taipei, Taiwan; Honiara, Solomon Islands; Guadalajara, Mexico; Mayaguez, Puerto Rico; and several places in the continental United States, while collecting data. Typically, we fly aircraft through the weather we are studying, along tracks we figured out far in advance – so that we can gather the data we need; gather data using radars (including Doppler radars), and use surface towers to make measurements near the earth’s surface.

This blog was inspired by a question at a recent video conference I had with teachers in Iowa.

Postscript: The paper was just accepted for publication.

More about the “Scientific Method”

February 25th, 2009

I have written before on the so-called “scientific method” (or rather “methods“). So have so many others. So I was kind of surprised when I heard someone who should have known better to define science simply as “inference based on data” (or, equivalently, drawing conclusions from data).

Then again, this might not be too surprising.

Think of a typical science project, which starts with a hypothesis and some background, then goes on to describe methods, and then discussion and conclusions. That sounds to me a lot like “inference based on data.” Does it to you?

Do you know what is missing?

There is a very important next step: the testing of those conclusions by other scientists.

In practice, the first step is a “friendly review” of a scientific paper by a colleague. Many organizations require that scientific papers go through an “internal review” before the scientist submits it to a scientific journal. “Internal” means the reviewer or reviewers work for the same organization. The author of the paper needs to respond to the comments of the internal reviewers before sending the paper off to the journal.

The second step is anonymous peer review. The Editor of the journal sends the paper to two or three scientists who are experts on the subject of the paper. These “peer reviewers” are asked to go through the paper carefully, and comment on whether the conclusions of the paper are supported, and whether the paper prevents new results. The author has to correct any problems, and the reviewers get to comment on the corrections. Based on the reviewers’ comments, the editor will “accept” the paper so that it is published, “reject” the paper, or ask the scientist for further revisions.

Often, even before the paper is written, the scientist will present results at a scientific meeting. This is a good test of whether the work is robust or not. Often, questions at scientific meetings are quite helpful, and the scientist’s project is improved as a result. Discussions in the hall or during meals can be as useful as those at the formal sessions.

figure_1_agu.jpg

Figure 1. December, 2008 meeting at the American Geophysical Union. Photo by Kevin Czajkowski. Some scientists are presenting posters describing their results. Other people are just talking. In either case, the scientists are learning from one another.

Once other scientists become aware of the work, they can begin to evaluate the results through their own work. The other scientists find out either through seeing the first scientist speak at a meeting, from reading about the work in the journal article, or from word of mouth. This results in new papers, which may refine the first scientist’s conclusions, or perhaps show that the first scientist’s conclusions are wrong. These papers, too, go through the review process.

So – science is “self-correcting.”

Even so, science is full of “blind alleys” along which sets of observations seemed to make sense, and even predict the results of future experiments. But then, something isn’t quite right – and scientists realize an alternate explanation for all those observations and experiments.

Some famous examples of “errors” from history are:

  • The planets having orbits that are perfect circles
  • Space being filled with something called “ether”
  • “phlogiston,” an element that was released when material was burned.

In these cases, the “correction” process took awhile, and you learn about it in your chemistry or physics classes. If you are not familiar with these concepts, you might want to do some research on the Web.

Here, I provide two examples of “self-correction” that happened quite rapidly. Both examples have to do with data from a large field campaign called GATE that occurred in 1974. During this field program, which involved 72 countries, scientists spent four months in Dakar, Senegal or in ships moored in the tropical Atlantic, taking measurements of the atmosphere and ocean with ships, aircraft, buoys, and a satellite (the first time satellite information was used in a large field program).

The first example involves measurements from aircraft of updrafts and downdrafts in thunderstorm clouds over the tropical ocean (or more accurately, cumulonimbus clouds, since there wasn’t much lightning). The aircraft would penetrate a single cloud, or cumulonimbus clouds arranged in a rainband or squall line. The scientists expected strong updrafts and downdrafts, but the updrafts and downdrafts sampled during GATE were surprisingly weak. The size and speed of these updrafts and downdrafts were reported in the literature, and followed by several papers on updraft and downdraft motions in cumulonimbus clouds in other locations over the tropical oceans.

A scientist wrote such a paper using aircraft measurements and submitted it to a scientific journal. The paper confirmed previous results. The paper went to the reviewers. At least one reviewer thought the paper was o.k. – After all, it was confirming previous results, basically strengthening the growing consensus that updrafts in cumulonimbus over the ocean were surprisingly weak – at least at altitudes below 5 kilometers, where the aircraft flew. But one reviewer somehow figured out that the author had been analyzing not the vertical speed of the air but the vertical speed of the aircraft! The authors had to withdraw the paper and do the data analysis over again.

The second example had to do with buoyancy of updrafts under fair-weather cumulus clouds, based on GATE aircraft data. GATE aircraft provided – for the first time, - abundant and usable measurements of temperatures and humidity just below cloud base, over the tropical Atlantic Ocean. One scientist was excited to find that the air feeding the clouds was buoyant, giving the clouds an extra kick. While updrafts beneath all clouds was warmer (buoyant) than the environment, the updrafts beneath the larger clouds was warmer and more buoyant than the updrafts beneath the small clouds. This made sense – the big clouds were growing more, so buoyant updrafts might be part of the reason the clouds were bigger, right?

Well, it turned out the reason that the updrafts were warmer was related to an instrument problem. Because the aircraft were flying over the ocean at altitudes as low as 30 meters above the surface, all the instruments, including the temperature sensors – were coated with salt from the ocean. (There are always some sea-salt particles in the air above the ocean.) When the relative humidity became high (which it does just below cloud base), the salt would absorb the water, which would liquefy, and this would release heat (condensing water releases latent heat). This warmed the temperature sensor, leading to artificially high temperatures. This effect was bigger for the bigger clouds because the sensors were exposed to humid updrafts for a longer time, so the air was warmer beneath the bigger clouds. Once the aircraft left the updraft, the air was drier, and the water on the sensor could evaporate again (and cool the sensor, making the air surrounding the cloud-base updrafts look cooler).

These results were presented at a scientific meeting – and the scientists at the meeting were quite excited. But the paper never got published, because of the discovery that the results had nothing to do with nature and everything to do with measurement error.

I was the scientist in the second example.

The inference based on the data looked correct to all of us, and thought to be reasonable by all of us. That is, until other scientists discovered the instrument problem, which happened after the meeting.

Looking back on this, this problem should have been obvious. There were measurements from three aircraft. On one aircraft, the technicians rinsed off the temperature sensor after every flight. On the second aircraft, the pilots deliberately flew through rain showers after each flight to rinse off the sensor – which didn’t happen if a rain shower wasn’t handy. And the temperature instrument on the third aircraft was rinsed only when the aircraft was required to go through rain (as would be the case when the aircraft were penetrating squall lines, for example).

And, you guessed it. The warming below clouds was greatest for the aircraft for which they did nothing, and the least for the aircraft with temperatures sensors rinsed daily!

So – when you do your science projects, and things seem to be working out right – remember that you might be missing something! But that is part of the fun of it.

Summary of the Surface Temperature Field Campaign

February 10th, 2009

Below is a summary of the results of Dr. Kevin Czajkowski’s surface-temperature field campaign conducted during December, 2008. The recently-posted blog “More Misconceptions about Climate Change, Part 2,” is just below this one. — PL

I wanted to write a wrap-up for the surface temperature field campaign. Dr. LeMone posted a great discussion of the relationship between surface temperature and air temperature (scroll down to 6 January blog). I felt cold just reading about temperatures of –27 C.

Many of the observations from the field campaign have been posted but not all have yet. If you still need to get your data online, please do so soon, as students from around the world will be working on their inquiry-based research projects. They may want to use your data. Also, several schools were not able to participate in December so they took observations in January and some schools are still taking observations now.

Thus far, 58 schools have entered data for the field campaign and there have been a total of 1584 observations. If you add up all of the surface temperature, snow, clouds and contrail observations, there have been 36,432 observations taken during the field campaign. Could you image trying to take all of those observations by yourself? I couldn’t.

I am really impressed with some of the schools that had many observations submitted. The school with the most observations was John Marshall High School in Glendale, West Virginia, USA with 122. Other notable schools are: Peebles High School, Peebles, Ohio, USA (94), Dalton High School, Dalton, Ohio, USA (77), and Oak Glen High School, New Cumberland, West Virginia, USA (81), elementary schools Main Street School, Norwalk, Ohio, USA (90) and St. Joseph School, Sylvania, Ohio, USA (84). In addition, a couple of schools in Poland took a large number of observations, Gimnazium No 1, Sochaczew, Poland (72) and Gimnazjum No 7 Jana III Sobieskiego, Rzeszow, Poland (62).

This year the weather cooperated pretty well and many of you were able to observe the surface temperature with snow on the ground. The deepest snow depth (288 mm) was measured by students at Nordonia Middle School, Northfield, Ohio, USA. Fifteen of the lowest 20 surface temperatures recorded were observed by students from Moosewood Farm Home School, Fairbanks, Alaska, USA. The lowest surface temperature that they recorded was –32 degrees Celsius. Another cold surface temperature (-26 degrees Celsius) was noted by Gimnazium No 1, Sochaczew, Poland. All of the warmest surface temperatures were recorded by students at Brazil High, Brazil Village, in Trinidad and Tobago with temperatures of +35-50 degrees C.

fig1.gif

Figure 1: Schools in GLOBE that participated in the surface temperature field campaign. Many are in Ohio because that is where I have funding for professional development.

Figures 2 and 3 show the relationship between surface temperature and snow in an area mainly covering Ohio, Michigan and West Virginia. These observations were not separated on the basis of water in the water.

fig2.gif

Figure 2. Student observations of snow depth, 8 December, 2009.

fig3.gif

Figure 3: Surface temperature as recorded by students on 8 December, 2008.

There is one thing to notice about the satellite imagery during this time period. Clouds obscured the ground most of the time. The image below, 7 December 2008, was the clearest image we could obtain of the Great Lakes regions. It seems that the observations in eastern Europe were cloud covered even more. The MODIS image depicts the surface temperature as the satellite went over and took observations on , 7 December 2008. The orange depicts part of Lake Huron that was ice covered.

fig4.gif

Figure 4. MODIS Surface temperature product (MOD11), 7 December, 2008.

Here is the list of all of the schools that participated.
Roswell Kent Middle School, Akron, OH, US [37 rows]
OHDELA, AKRON, OH, US
Capital High School, Charleston, WV, US [6 rows]
Dalton High School, Dalton, OH, US [77 rows]
Chartiers-Houston Jr./Sr. High School, Houston, PA, US [28 rows]
Lakewood Middle School, Hebron, OH, US [10 rows]
Cloverleaf High School, Lodi, OH, US [60 rows]
The Morton Arboretum Youth Education Dept., Lisle, IL, US [9 rows]
Peebles High School, Peebles, OH, US [94 rows]
North Marion High School, Farmington, WV, US
Christensen Middle School, Livermore, CA, US [2 rows]
Gimnazjum No 7 Jana III Sobieskiego, Rzeszow, PL [62 rows]
Gateway Middle School, Maumee, OH, US [9 rows]
Penta Career Center, Perrysburg, OH, US [8 rows]
Canaan Middle School, Plain City, OH, US [28 rows]
Mill Creek Middle School, Comstock Park, MI, US [24 rows]
Brazil High, Brazil Village, TT [30 rows]
Kilingi-Nomme Gymnasium, Parnumaa, EE [42 rows]
Montague Elementary School, Montague, NJ, US [2 rows]
Swift Creek Middle School, Tallahassee, FL, US [19 rows]
National Presbyterian School, Washington, DC, US [15 rows]
The Bryan Center, Bryan, OH, US [16 rows]
Baltimore Polytechnic Institute, Baltimore, MD, US [2 rows]
Reams Home School, Wellington, OH, US [36 rows]
Maumee High School, Maumee, OH, US [16 rows]
Whittier Elementary School, Toledo, OH, US [6 rows]
Huntington High School, Huntington, WV, US [29 rows]
St. Joseph School, Sylvania, OH, US [84 rows]
Russia Local School, Russia, OH, US [24 rows]
Warrensville Heights High School, Warrensville Heights, OH, US [2 rows]
WayPoint Academy, Muskegon, MI, US
Gimnazium No 1, Sochaczew, PL [72 rows]
Moosewood Farm Home School, Fairbanks, AK, US [27 rows]
St. Michael Parish School, Wheeling, WV, US [14 rows]
Anthony Wayne High School, Whitehouse, OH, US [13 rows]
Bellefontaine High School, Bellefontaine, OH, US [36 rows]
Oak Glen High School, New Cumberland, WV, US [81 rows]
Barberton High School, Barberton, OH, US [37 rows]
Nordonia Middle School, Northfield, OH, US [34 rows]
Aurora Elementary School, Aurora, WV, US [13 rows]
Orrville High School, Orrville, OH, US [15 rows]
Bowling Green Christian Academy, Bowling Green, OH, US [26 rows]
Polly Fox Academy, Toledo, OH, US [18 rows]
McTigue Middle School, Toledo, OH, US [9 rows]
Highlands Elementary School, Naperville, IL, US [8 rows]
South Suburban Montessori School, Brecksville, OH, US [34 rows]
NASA IV&V Educator Resource Center, Fairmont, WV, US
John Marshall High School, Glendale, WV, US [122 rows]
Boys’ Village School, Wooster, OH, US [9 rows]
Birchwood School, Cleveland, OH, US [43 rows]
Lebanon High School, Lebanon, OH, US [9 rows]
Central Catholic High School, Toledo, OH, US [4 rows]
Eastwood Middle School, Pemberville, OH, US [18 rows]
Orange Elementary School, Waterloo, IA, US
Hudsonville High School, Hudsonville, MI, US [27 rows]
The University of Toledo, Toledo, OH, US [32 rows]
O. W. Holmes Elementary School, Detroit, MI, US [11 rows]
Main Street School, Norwalk, OH, US [90 rows]

That is all from this year’s surface temperature field campaign. Maps were prepared by Nancy Cochran and Timothy Ault of the University of Toledo.
Dr. C.

Thank you, Dr. C., and all the students and teachers who participated in this field campaign! – PL